Bitget App
Trade smarter
Buy cryptoMarketsTradeFuturesStocksEarnInstitutionAI & More
Hyperliquid Price Breaks Out as S&P 500 Perpetual Futures Launch

Hyperliquid Price Breaks Out as S&P 500 Perpetual Futures Launch

CryptoNewsNetCryptoNewsNet2026/03/19 20:09
By:CryptoNewsNet
Back to the list

Hyperliquid Price Breaks Out as S&P 500 Perpetual Futures Launch 

Hyperliquid Price Breaks Out as S&P 500 Perpetual Futures Launch  image 0  cryptonewsz.com 21 m
Hyperliquid Price Breaks Out as S&P 500 Perpetual Futures Launch  image 1
  • Hyperliquid price gives a high-momentum breakout from the resistance trendline of rising wedge pattern.
  • S&P Dow Jones Indices licensed its flagship S&P 500 index to Trade[XYZ] for blockchain-based derivatives.
  • The 20-day EMA slope could act as a dynamic support to bolster price recovery with occasional pullback in price

$HYPE, the native cryptocurrency of the decentralized exchange (DEX), Hyperliquid, jumped roughly 3.5% on Wednesday, to reach a current trading value of $42.5. A primary catalyst to this surge can be attributed to the launch of S&P 500 perpetual futures contracts on Hyperliquid, through Trade[XYZ]. This expands the utility of the platform, attracting new capital and surge in fee revenue. Is the Hyperliquid price ready to surpass the $40 barrier?

First-Ever Official S&P 500 DeFi Contract Launches on Hyperliquid

S&P Dow Jones Indices recently agreed to license its flagship S&P 500 index to Trade[XYZ], a platform that specializes in real-world asset derivatives on the Hyperliquid blockchain. This partnership has allowed the implementation of what is billed as the first official sanctioned perpetual futures contract on the S&P 500.

Hyperliquid, a decentralized exchange that is optimized for high speed trading, now hosts this perpetual product via Trade[XYZ]. Traders outside of the United States that are qualified can open leveraged positions — long or short — on the performance of the index at any hour without an expiration date to force closure of the position.

The S&P 500 already underlies tremendous daily volumes of over $1 trillion across traditional instruments, such as futures and options, exchange-traded funds and various structured products on traditional venues. By having an authorized version of on-chain, the set up enables non-stop trading that increases with the rhythms of the crypto markets instead of the limited hours of stock exchanges.

Unlike previous unofficial or fake replication of S&P 500 exposure in decentralized finance, this contract is based directly on S&P DJI’s institutional grade, real-time index feeds. The move ties one of the most referenced benchmarks in finance more directly in with speculation based on blockchain.

Hyperliquid Price Gave A Decisive Breakout From Wedge Pattern

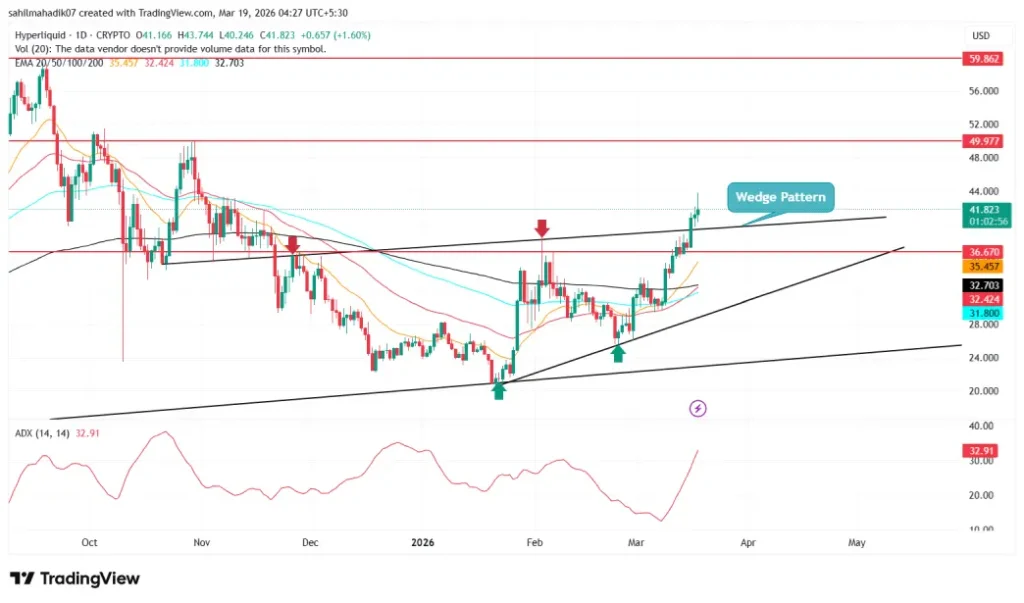
On March 16th, the Hyperliquid price gave a decisive breakout from the resistance trendline of a rising wedge pattern, in the daily chart. Since November 2025, the coin price has resonated steadily within the two converging trendlines which offer dynamic resistance and support to price.

An upside breakout from this pattern further reinforces the market buying pressure and bolsters the asset for a higher rally.’ In addition, the 50-day EMA slope is poised to cross the 200-day EMA slope indicating potential buy signals.

Currently, the overhead supply above $41.3 resistance may force temporary pullback in price retest the breached trendline for fresh support. Validating price sustainability at a higher price is needed to drive sustainable growth in market

With sustained buying, the post-breakout rally could push the asset to the initial target of $50, followed by the $59.8 mark.
Hyperliquid Price Breaks Out as S&P 500 Perpetual Futures Launch  image 2
$HYPE/USDT -1d chart

On the contrary, if the Hyperliquid price breaks below the breached trendline, the sellers could strengthen their grip over the asset, and invalidate prevailing bullish thesis.

0
0

Disclaimer: The content of this article solely reflects the author's opinion and does not represent the platform in any capacity. This article is not intended to serve as a reference for making investment decisions.

Understand the market, then trade.
Bitget offers one-stop trading for cryptocurrencies, stocks, and gold.
Trade now!

You may also like

NEWMARK GROUP INC <NMRK.O>: KBW CUTS TARGET PRICE TO $16 FROM $17.50

NEWMARK GROUP INC : KBW CUTS TARGET PRICE TO $16 FROM $17.50

Reuters•2026/10/09 05:31

VALERO ENERGY CORP <VLO.N>: JEFFERIES CUTS TARGET PRICE TO $394 FROM $401

VALERO ENERGY CORP : JEFFERIES CUTS TARGET PRICE TO $394 FROM $401

Reuters•2026/10/09 04:52

The Shopify Stock Rally Isn't Done: Chart of the Week -- Barrons.com

By Doug Busch Shopify is no longer a pandemic-era growth story that simply failed to slow down. It is compounding at a pace few software platforms its size still manage. In the second quarter of 2026, sales on its platform rose 32%. That was the fifth straight quarter of growth exceeding 30%. Merchants are also using more of Shopify's own tools, from payments to Shop Pay, and new channels like AI shopping agents are starting to increase demand. The simple bull case is that the stock already commands a huge share of independent online commerce, and that position should become more valuable as more buying moves through its checkout. A rule of market mechanics is that the vast majority of an individual security's gain is driven by its underlying sector. Within technology, software has staged a robust recovery, joining semiconductors to power the broader sector higher. The iShares Expanded Tech-Software Sector ETF has maintained an upward trajectory since its mid-April lows, though the advance from $74 to $112 has been choppy as bulls repeatedly stepped in to defend when necessary. Breadth across large-cap software has expanded significantly, with 24 constituents surging over 20% over the past three months. During that same three-month window, Shopify generated outstanding relative strength, advancing 36%, more than doubling the IGV's 17% gain over the same period. Expect the stock's outperformance to persist as software momentum broadens. Let's examine the daily and monthly charts to outline the technical drivers behind this thesis. Looking at the daily chart, the ratio chart against the IGV shows persistent outperformance extending back to mid-May. The stock is riding an eight-session winning streak, during which price action cleared a double-bottom-with-handle pivot at $151.39. Within this broader base, the stock recorded a bullish golden cross in late August and successfully filled its Sept. 10 price gap, tracing back to its Aug. 4 session, the day before a powerful earnings reaction sent the stock surging 17% hi

Dow Jones•2026/10/09 03:10