Bitget App
Trade smarter
Buy cryptoMarketsTradeFuturesStocksEarnInstitutionAI & More
Majority of XRP Retail Would “Crumble” at This Q4 Triangle Crossroads: Analyst

Majority of XRP Retail Would “Crumble” at This Q4 Triangle Crossroads: Analyst

CryptoNewsNetCryptoNewsNet2026/03/19 17:25
By:CryptoNewsNet
Back to the list

Majority of XRP Retail Would “Crumble” at This Q4 Triangle Crossroads: Analyst

Majority of XRP Retail Would “Crumble” at This Q4 Triangle Crossroads: Analyst image 0  thecryptobasic.com 16 m
Majority of XRP Retail Would “Crumble” at This Q4 Triangle Crossroads: Analyst image 1

$XRP is approaching a critical technical juncture that could test investor conviction.

Analyst ChartNerd warns that most retail holders may struggle to endure what comes next before a potential long-term breakout.

At the time of writing, $XRP trades around $1.45 after a recent push toward $1.60, maintaining short-term strength despite market uncertainty. However, new chart analysis suggests the path forward may not be smooth.

Key Points

  • $XRP nears a critical Q4 “triangle crossroads,” testing retail investor conviction.

  • Analyst warns weaker hands may exit before a potential $10 long-term surge.

  • Gaussian Channel signals a possible pullback to $0.73 amid historical patterns.

  • $XRP consolidates near $1.45, with major resistance at $1.80–$2.40 still intact.

Q4 “Triangle Crossroads” Signals Possible Shakeout

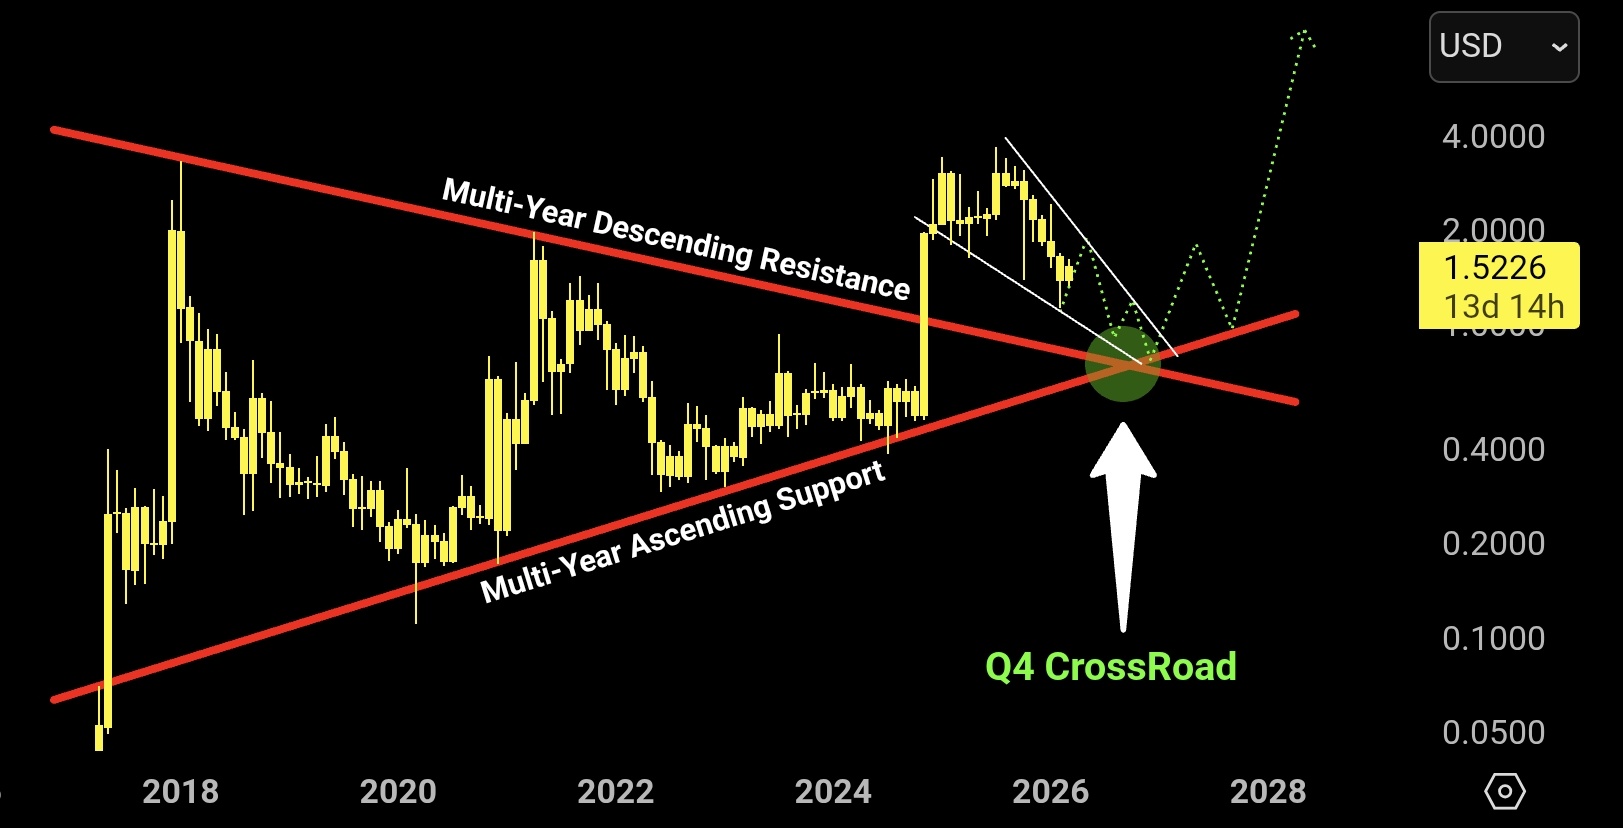
According to ChartNerd, $XRP is moving toward a multi-year “triangle crossroads” formation, where long-term ascending support meets descending resistance.

This structure, visible on the macro chart, points to a decisive moment expected around Q4 2026. While such formations often precede major breakouts, the analyst cautions that a final shakeout could come first.

He suggests $XRP could drop to the $0.70 to $0.80 range before any sustained expansion. In particular, ChartNerd argues for a 7X price surge toward $10 or higher after the $0.7 retest.
Majority of XRP Retail Would “Crumble” at This Q4 Triangle Crossroads: Analyst image 2

The projected move implies a deep correction that could force weaker hands out of the market before a stronger bullish phase begins.

Gaussian Channel History Points to $0.73 Retest

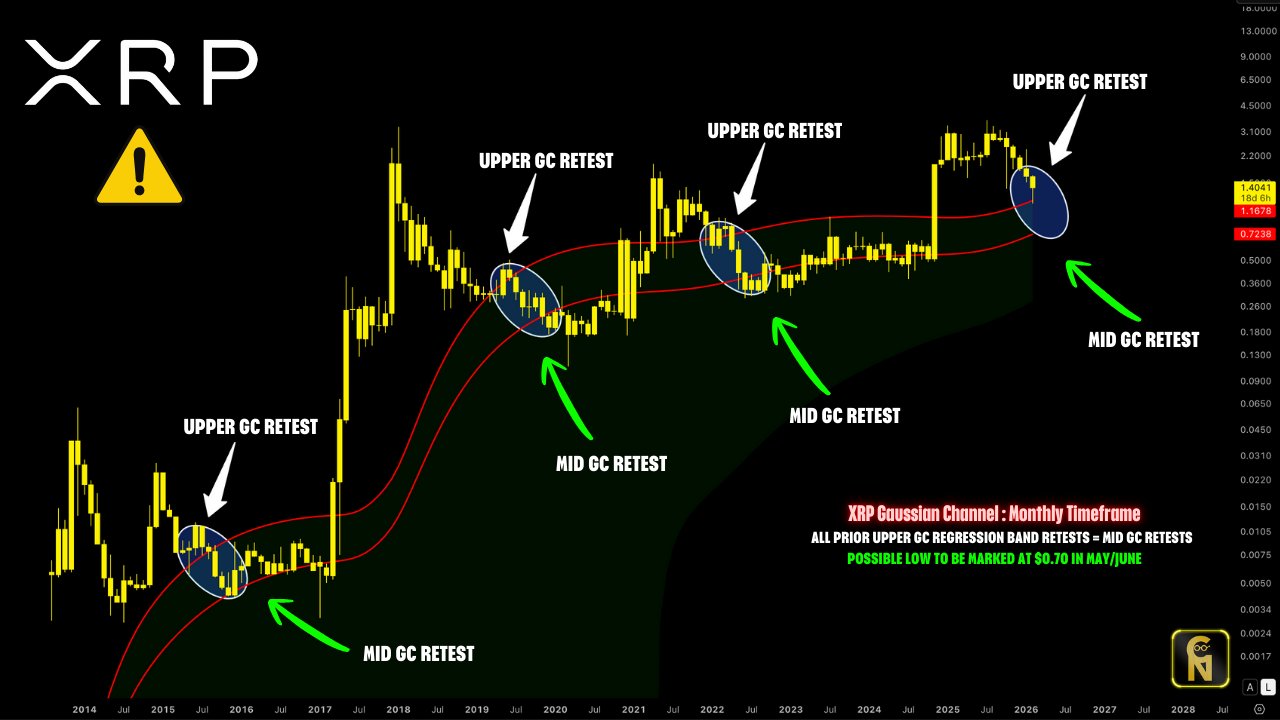
In a separate analysis, ChartNerd highlighted a repeating pattern using the Gaussian Channel on the monthly timeframe.

Historically, every time $XRP taps the upper Gaussian Channel (GC) regression band, it eventually retraces to the mid-band. In the current cycle, $XRP has already touched the upper band but has yet to revisit the mid-level.

That mid GC band currently sits around $0.73, reinforcing the possibility of a deeper pullback.

The analyst noted that while March could still bring short-term volatility or upside, historical patterns suggest that “history often rhymes,” hinting that a correction phase may still be incomplete.
Majority of XRP Retail Would “Crumble” at This Q4 Triangle Crossroads: Analyst image 3

$XRP Resistance Levels Still in Focus

Despite the bearish warning, $XRP’s recent recovery remains notable. The asset has rebounded strongly from earlier lows. However, major resistance zones at $1.80, $2.00, and $2.40 remain unbroken. Previous rejections around these levels continue to define $XRP’s current structure.

Until $XRP clears these barriers, analysts argue that downside risks, including a move toward sub-$1 levels, remain in play.

In the near term, $XRP is consolidating under $1.50, showing signs of stability. This could lead to another breakout attempt if momentum builds.

Ultimately, $XRP sits at a crossroads, one that could either confirm a bullish breakout or trigger the kind of correction that, as ChartNerd suggests, many retail investors may not be prepared to withstand. For context, a drop to $0.7 from the current level would mark a massive 51% drawdown.

0
0

Disclaimer: The content of this article solely reflects the author's opinion and does not represent the platform in any capacity. This article is not intended to serve as a reference for making investment decisions.

Understand the market, then trade.
Bitget offers one-stop trading for cryptocurrencies, stocks, and gold.
Trade now!

You may also like

NEWMARK GROUP INC <NMRK.O>: KBW CUTS TARGET PRICE TO $16 FROM $17.50

NEWMARK GROUP INC : KBW CUTS TARGET PRICE TO $16 FROM $17.50

Reuters•2026/10/09 05:31

VALERO ENERGY CORP <VLO.N>: JEFFERIES CUTS TARGET PRICE TO $394 FROM $401

VALERO ENERGY CORP : JEFFERIES CUTS TARGET PRICE TO $394 FROM $401

Reuters•2026/10/09 04:52

The Shopify Stock Rally Isn't Done: Chart of the Week -- Barrons.com

By Doug Busch Shopify is no longer a pandemic-era growth story that simply failed to slow down. It is compounding at a pace few software platforms its size still manage. In the second quarter of 2026, sales on its platform rose 32%. That was the fifth straight quarter of growth exceeding 30%. Merchants are also using more of Shopify's own tools, from payments to Shop Pay, and new channels like AI shopping agents are starting to increase demand. The simple bull case is that the stock already commands a huge share of independent online commerce, and that position should become more valuable as more buying moves through its checkout. A rule of market mechanics is that the vast majority of an individual security's gain is driven by its underlying sector. Within technology, software has staged a robust recovery, joining semiconductors to power the broader sector higher. The iShares Expanded Tech-Software Sector ETF has maintained an upward trajectory since its mid-April lows, though the advance from $74 to $112 has been choppy as bulls repeatedly stepped in to defend when necessary. Breadth across large-cap software has expanded significantly, with 24 constituents surging over 20% over the past three months. During that same three-month window, Shopify generated outstanding relative strength, advancing 36%, more than doubling the IGV's 17% gain over the same period. Expect the stock's outperformance to persist as software momentum broadens. Let's examine the daily and monthly charts to outline the technical drivers behind this thesis. Looking at the daily chart, the ratio chart against the IGV shows persistent outperformance extending back to mid-May. The stock is riding an eight-session winning streak, during which price action cleared a double-bottom-with-handle pivot at $151.39. Within this broader base, the stock recorded a bullish golden cross in late August and successfully filled its Sept. 10 price gap, tracing back to its Aug. 4 session, the day before a powerful earnings reaction sent the stock surging 17% hi

Dow Jones•2026/10/09 03:10