

 thecryptobasic.com
Cardano may have seen its worst days, as recent upward momentum suggests that the elongated consolidation is nearing its conclusion.
This position is notable because it offers a glimmer of hope to $ADA holders, who have endured harsh market conditions. After nearly missing out on the concluding bullish market phase, Cardano has also corrected sharply from the cycle’s peak, undermining investor confidence. However, these dark days may be coming to an end.
Key Points
- For about 45 days, the price of $ADA has remained contained between support near $0.245 and resistance around $0.304, creating a tight consolidation.
- During this 45-day period, $ADA retested the $0.304 resistance level three times, suggesting that selling pressure at this level may be weakening.
- A confirmed move above $0.304 would shift momentum to the bullish side, clearing the path toward higher levels around $0.338 and $0.376.
- The 1.618, 1.272, 0.618, and 0.236 Fibonacci levels at $0.597, $0.725, $0.966, and $1.106 are the next major resistance levels of interest if $0.376 clears.
- If Cardano fails to break through the upper resistance, the lower boundary near $0.245 remains the key area to watch
Prolonged Cardano Consolidation
A TradingView analysis from CoinCodex highlighted this trend. It emphasized that Cardano has spent several weeks moving within a narrow range, but the structure now appears to be approaching a breakout. For about 45 days, the price of $ADA has been contained between support near $0.245 and resistance around $0.304, creating a tight consolidation that reflects a balance between buyers and sellers.
This prolonged sideways movement often signals a buildup phase, where pressure gradually increases before a directional move. With price now pushing closer to the upper boundary, attention is shifting toward whether this range will finally break.
Cardano Resistance Retest Signals Imminent Move
The repeated tests of the $0.304 level suggest that selling pressure at this zone may be weakening. During this 45-day period, $ADA retested the zone three times. The first attempt was on February 15, when it peaked at $0.302.
It also retested this supply zone on February 25, rallying to $0.313 before being pegged back. Cardano’s last attempt was yesterday, when it reached an intraday high of $0.295, but bears stepped in again.
Although $ADA has retraced 9% from that high, its persistent retest pressures this resistance zone. This type of setup typically leaves room for an eventual breakout and a consequent impulsive move, especially as the asset has already spent an extended period consolidating.
Defining Levels and Major Resistance Targets
CoinCodex cited an analysis from prominent chartist Ali Martinez, which highlighted that a confirmed move above $0.304 would shift momentum to the bullish side. Under this condition, the path toward higher levels around $0.338 and $0.376 becomes clear. Notably, these are areas where previous liquidity pockets exist.
A shared chart shows further upside target remains. The 1.618, 1.272, 0.618, and 0.236 Fibonacci levels at $0.597, $0.725, $0.966, and $1.106 are the next major resistance levels of interest.
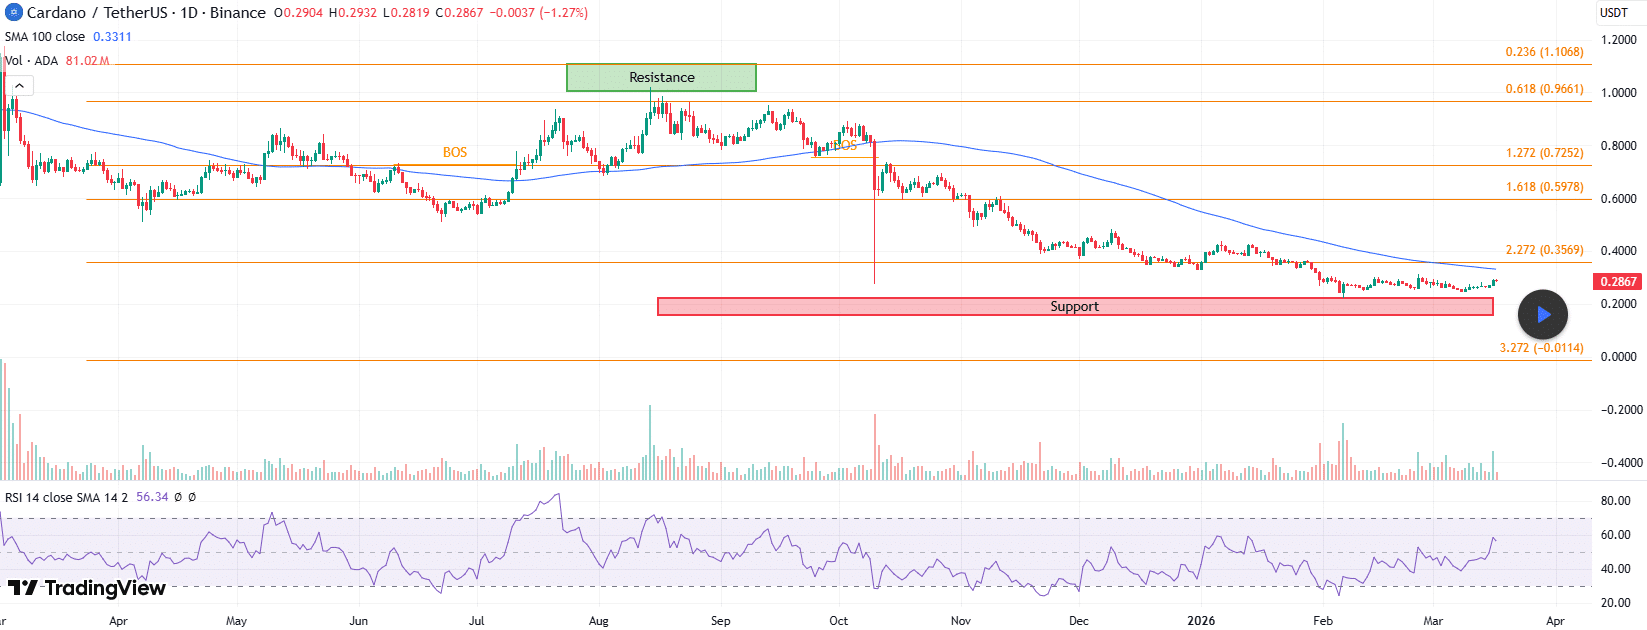
On the other hand, if Cardano fails to break through the upper resistance, the lower boundary near $0.245 remains the key area to watch. Further price weakness would force a retest of the February 6 low of $0.220.
Looking at the broader context, the $ADA price remains more than 90% below its previous cycle peak of $3.10, suggesting selling pressure may be nearing exhaustion. This backdrop often aligns with accumulation phases, where markets stabilize before attempting a larger move.


