

 thecryptobasic.com
$XRP has held up nicely around a key price level, and a continued trend above it suggests massive bullish potential for the altcoin.
Despite $XRP retracing considerably over the past few days, correcting 9% from its Tuesday high of $1.60, it remains above a major price area. This show of strength amid the market uncertainty could be the backbone for an impulse move higher.
Key Points
- Despite $XRP retracing considerably over the past few days, correcting 9% from its Tuesday high of $1.60, it remains above a major price area.
- As long as the price holds above this zone, the long-term structure remains constructive.
- A visible resistance area is forming around the $1.8 mark, and a sustained move into this area would indicate that momentum is building.
- A chart shows that the current price action is part of a broader 5-phase Elliott Wave pattern, with $XRP currently in the fourth wave.
- The target for wave 5 is an upsurge to a new all-time high around $8, representing a 448% increase from the current price of $1.46.
$XRP Strong Above Key Level
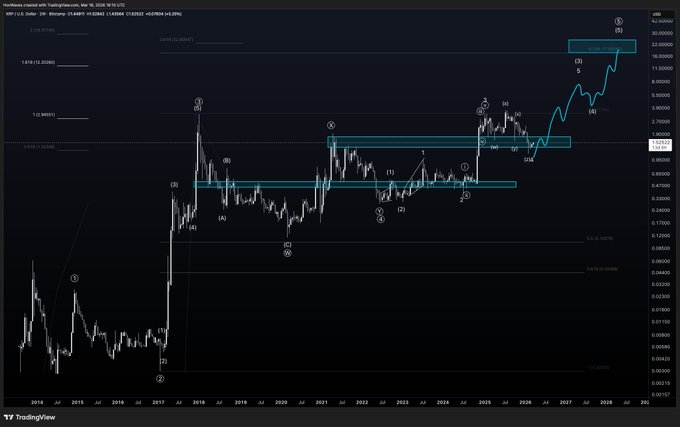
Hov, an Elliot Wave specialist, noted that $XRP is showing signs of recovery after bouncing from its recent lows around $1.1, with price holding firmly above a key support zone. This area, which previously acted as a supply zone in previous cycles, is now serving as a base.
For context, an accompanying 2-week chart shows that $XRP peaked around this area during the 2020/2021 bull market. The coin reached a high of $1.96 in April 2021 but faced strong selling pressure. Subsequent attempts to retest this higher in May 2021 failed, with $XRP failing to close above $1.56. The persistent correction around this zone established it as a strong supply area.
 $XRP Holds Support/Hov">
However, $XRP broke above this resistance in November 2024 and eventually peaked at $3.66 in July 2025. The altcoin has been correcting since then, dropping over 60% from the high to its current price. Yet it has not broken below the resistance-turned-support price range identified in the analyst’s chart.
The structure suggests that buyers are consistently stepping in around this demand zone, helping stabilize the price when weakness intensifies. This reaction has allowed $XRP to stand strong above this key level, keeping bullish possibilities intact.
Next Resistance at $1.8 Crucial
Despite the ongoing pullback, $XRP has respected the lower boundary of this range once again, reinforcing its importance as a support level. As long as the price remains above this zone, the long-term structure remains constructive.
Nonetheless, a visible resistance area is forming around the $1.8 mark. This zone aligns with the upper band of the support range, and the asset is gradually pushing back toward it. A sustained move into this area would indicate that momentum is building, but the reaction there will be critical.
5-Wave Structure Points to New $XRP ATHs
From a broader perspective, Hov outlines a potential progression toward higher price zones if $XRP sustains the trend above the current support level. The chart shows that the current price action is part of a broader 5-phase Elliott Wave pattern.
Presently, the structure is on its corrective fourth wave. The first wave completed when $XRP hit a high of $0.93 in July 2023, and the second played out during the pullback to $0.38 in July 2024. Further, wave 3 pushed the coin to a high of $3.40 in January 2025 before the corrective fourth wave started.
As long as $XRP holds above the current support area, it signals that the fourth wave is completing. This is crucial, as the analyst highlighted that the aim is to get the fifth bullish wave moving rather than ending up with just a 3-wave Elliott Wave pattern.
Meanwhile, the target for wave 5 is an upsurge to a new all-time high around $8, representing a 448% increase from the current price of $1.46. So far, the major catalyst remains in place, with $XRP holding above the key support level.


