


While $XRP recently breached the “Adam and Eve” neckline, it must first overcome three important EMAs to confirm a full bullish reversal.
$XRP has broken above the $1.5 Adam and Eve neckline resistance, recording its highest daily close in over 30 days and indicating that buyers are stepping back into the market.
The short-term outlook now depends on whether $XRP can hold $1.5 as support and continue toward higher targets. Notably, above the neckline, $XRP faces three major EMA hurdles that will determine whether the broader bullish reversal is real.
Key Points
- $XRP recently broke above the $1.50 Adam and Eve neckline on March 16, recording its highest daily close in over 30 days.
- The $XRP price must now reclaim the 10 EMA at $1.56, the 20 EMA at $1.8, and the 50 EMA at $2 to confirm a full bullish reversal.
- These important EMAs have formed death crosses beneath the $XRP price, confirming the prevalent downtrend.
- The $1.80 price level, which aligns with the 20 EMA, acted as a support base for roughly 13 months before $XRP lost the level in January 2026.
- Data identifies $1.42 as the major ascending support level $XRP could fall back to if it fails to hold $1.50.
$XRP Breaks Above Adam and Eve Neckline Resistance
Chart Nerd, a well-known market watcher, discussed these levels in his latest $XRP analysis. He stressed that $XRP’s break above the $1.50 neckline on Monday, March 16, represented its highest daily close in over 30 days.
According to him, this is a strong signal that buyers may now be stepping in and that bullish momentum could be building. He stressed that the most important thing in the short term is whether $XRP can hold $1.5 as support and push toward his projected target of $1.8.
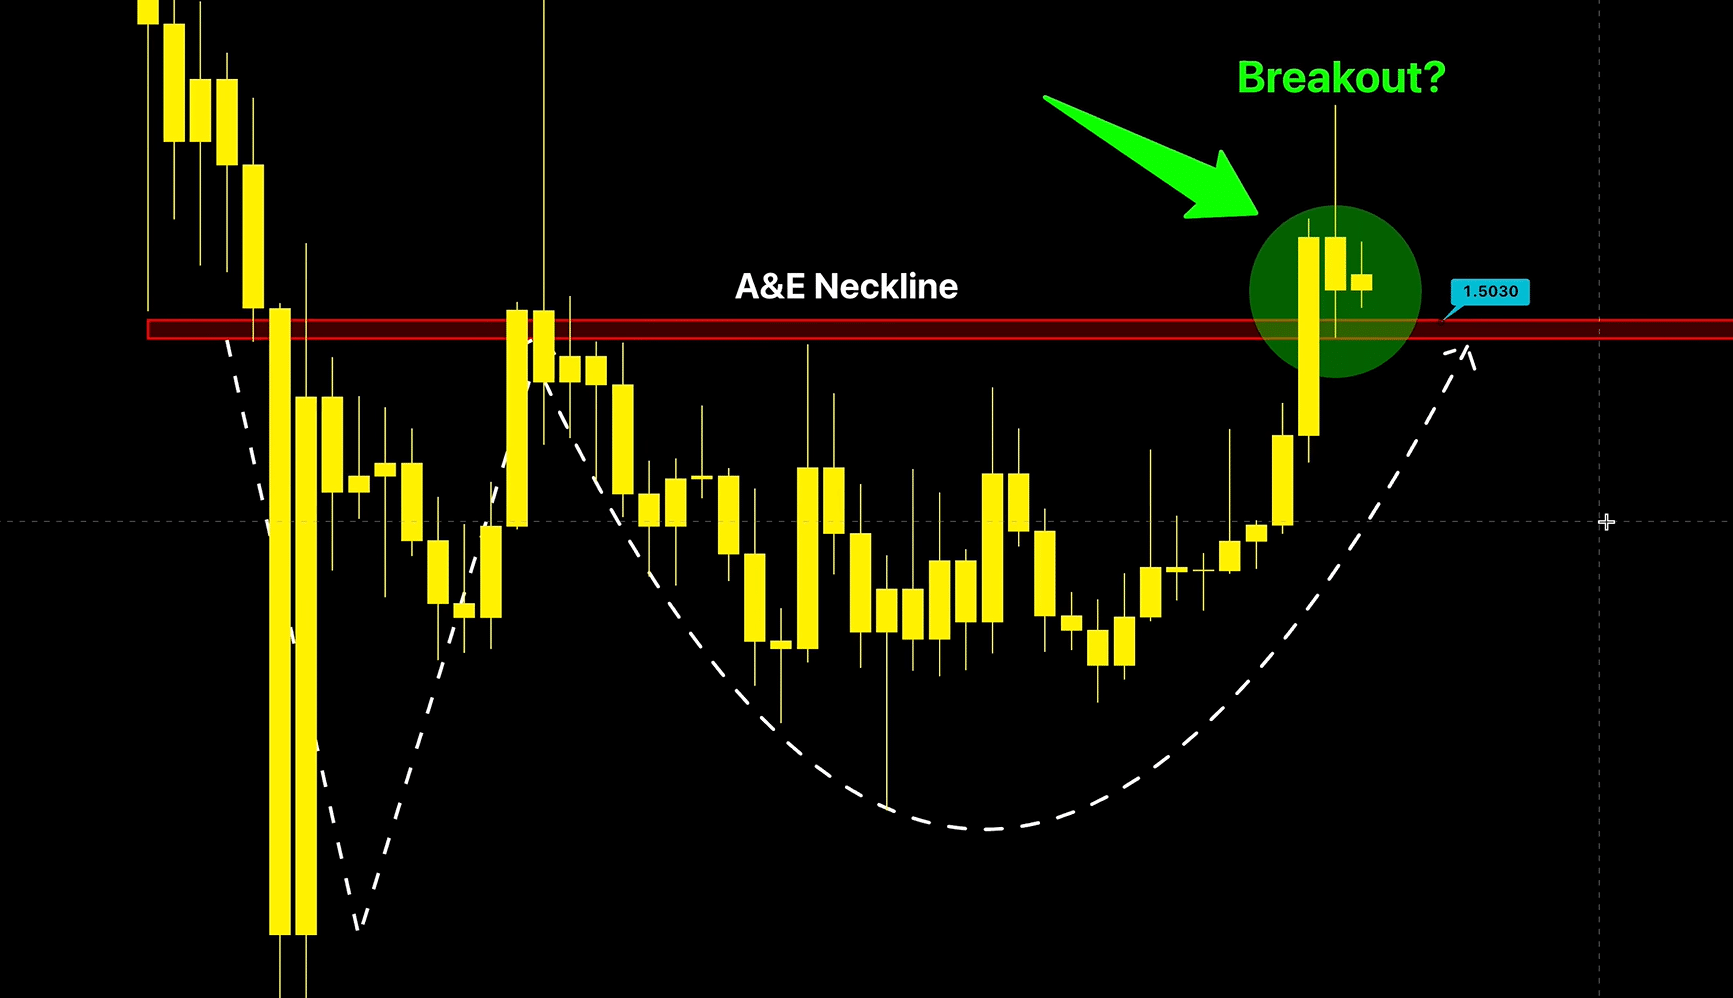
For the uninitiated, the Adam and Eve pattern consists of two recovery structures. The Adam is a V-shaped recovery that forms after a sharp price drop, while the Eve is a rounded bottom that develops after the price falls gradually from the neckline, revisits the previous low, and then works its way back up to the neckline.
For $XRP, the Adam structure played out when the price fell from $1.54 in early February to a low of $1.33 on Feb. 12, then recovered to the neckline around $1.5 on Feb. 15.
$XRP then formed the Eve structure by sliding back to support around $1.33 from late February through early March, before gradually climbing back up and breaking above $1.5 on March 16. Chart Nerd noted that $XRP has continued to hold the neckline since the breakout despite the recent pullback.
Holding $1.5 Remains the Short-Term Priority
The analyst suggested that holding $1.5 as support remains the most important short-term task following the breakout. If $XRP fails to hold above this neckline, the daily timeframe features an ascending trend line as the next level of support, currently sitting in the $1.42 range.
He drew this ascending support from the early February low of $1.1 through the higher low of $1.33 on March 9, pointing out that it gives $XRP a potential base for another breakout attempt if $1.5 breaks down.
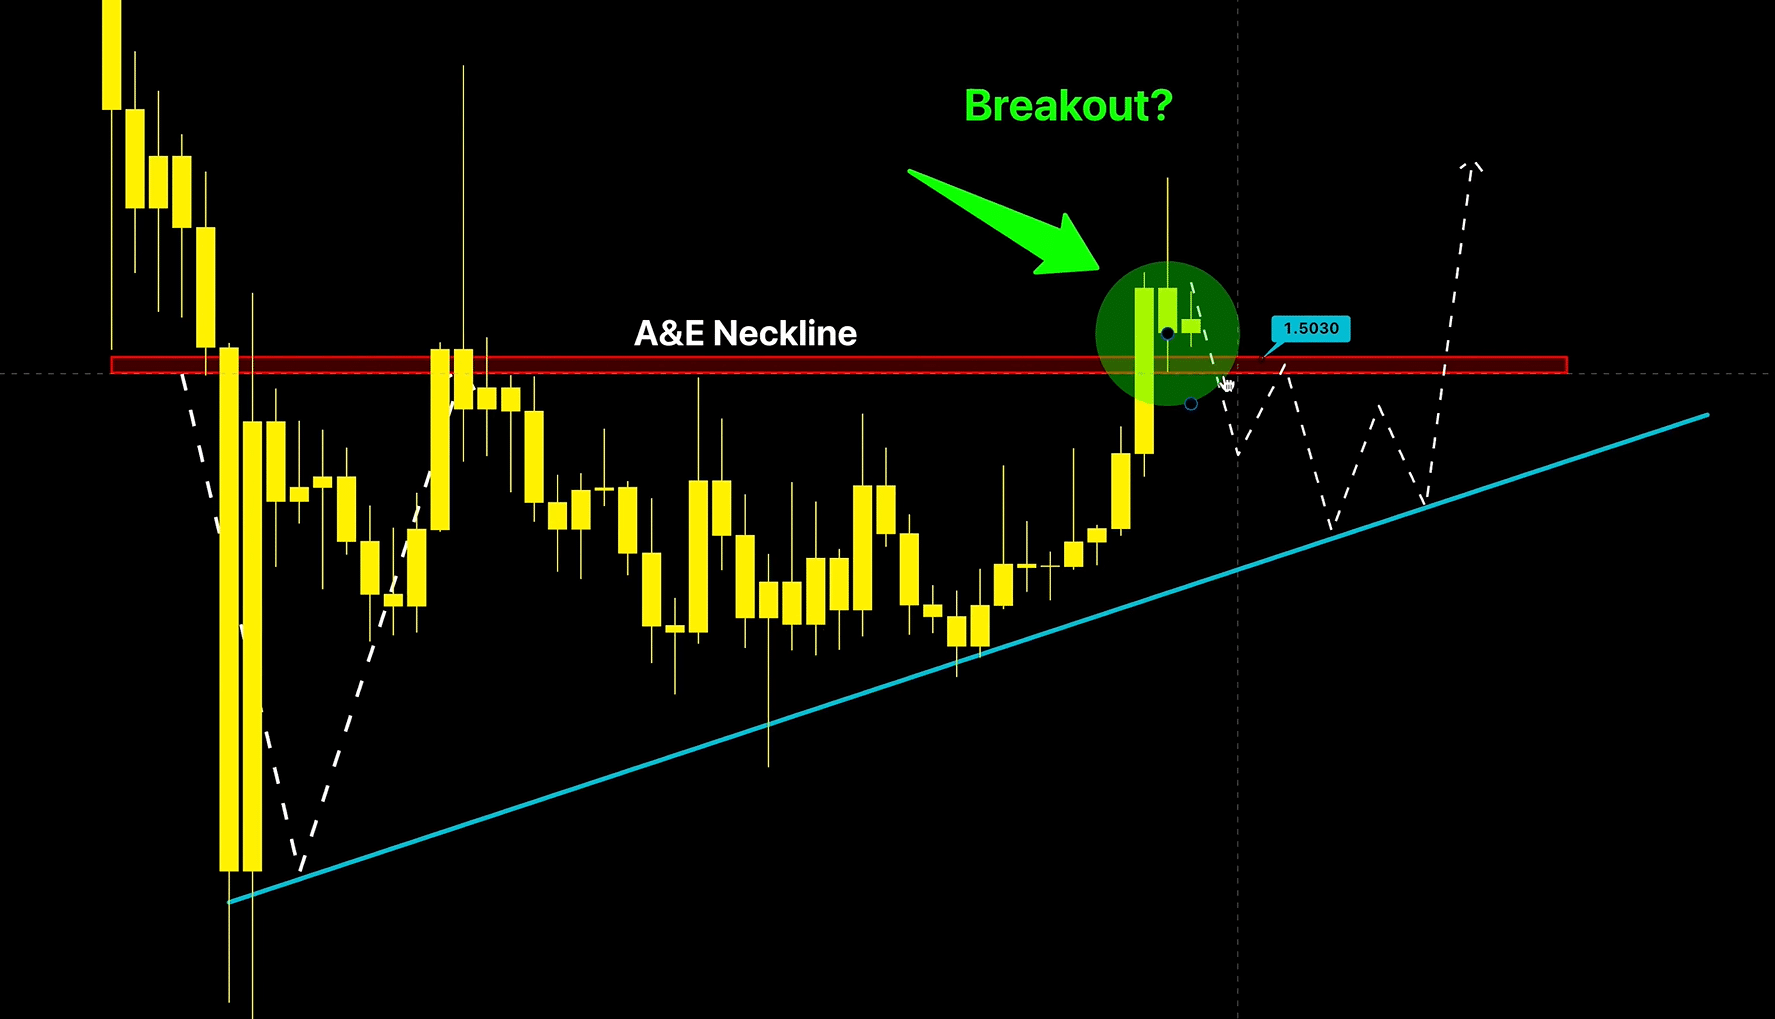
Chart Nerd also called attention to a positive development that could help the $1.5 level hold. Specifically, the U.S. SEC recently classified $XRP alongside 15 other assets as digital commodities. Responding to this, the analyst suggested that this could work as a short-term price driver.
Three EMAs Stand Between $XRP and a Confirmed Bullish Reversal
Chart Nerd then identified three EMAs that $XRP needs to break and reclaim to confirm a real bullish reversal. The first is the 10 EMA, shown as a blue line on his chart, currently sitting at $1.56. He noted that $XRP was already running into this level at the time of his analysis and that a confirmed close above $1.56 would open the door to the next target.
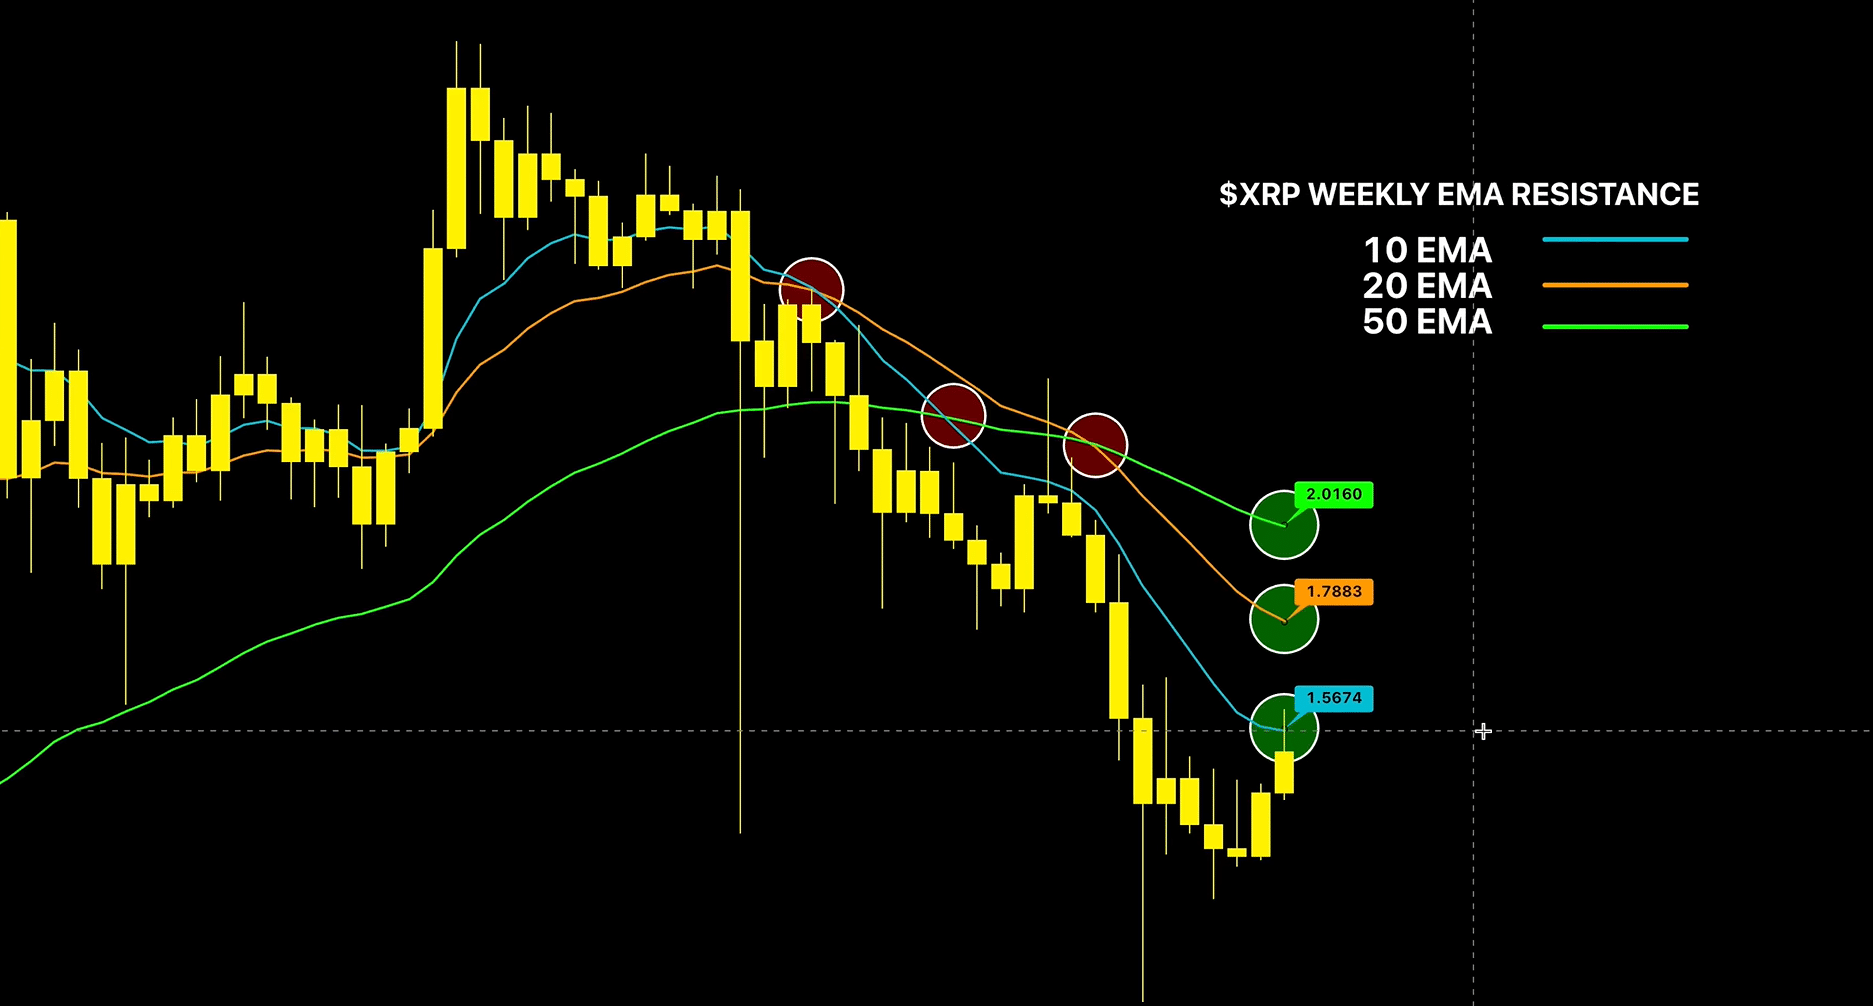
That next target is the 20 EMA, an orange line, currently at $1.8. Chart Nerd pointed out that $1.8 also acted as a support base for roughly 13 months before $XRP lost that level in January 2026. Meanwhile, the third level is the 50 EMA at $2.
The analyst explained that $XRP currently sits below all three EMAs, and that these levels have also produced death crosses, confirming the downtrend. Until $XRP breaks and reclaims all three, the broader bearish trend remains in place.


