

 thecryptobasic.com
Cardano is trading near an accumulation zone that has historically sparked a massive price rebound to much higher levels.
This multi-year accumulation zone closely aligns with a crucial demand zone, where buyers have stepped in to defend aggressively. So far, Cardano ($ADA) has held nicely around this support level, fueling optimism that history could repeat.
Key Points
- Cardano is trading near an accumulation zone that has historically sparked a strong price rebound to much higher prices.
- $ADA is holding within a broad support range of $0.18 to $0.25, a zone that has repeatedly served as a foundation in previous cycles.
- A descending trendline resistance line, which began forming after the 2021 $ATH, has capped upside attempts in recent years.
- If the current base continues to hold and $ADA eventually clears the descending resistance, a sequence of higher targets could come into play.
Cardano at Multi-Year Accumulation Zone
According to top market analyst Crypto Patel, Cardano is currently trading in a long-standing accumulation area. The zone has been developing over several years, and its impact on the asset’s price trajectory is increasingly drawing attention.
An accompanying 2-week chart shows its price holding within a broad support range of $0.18 to $0.25, a zone that has repeatedly served as a foundation in previous cycles.
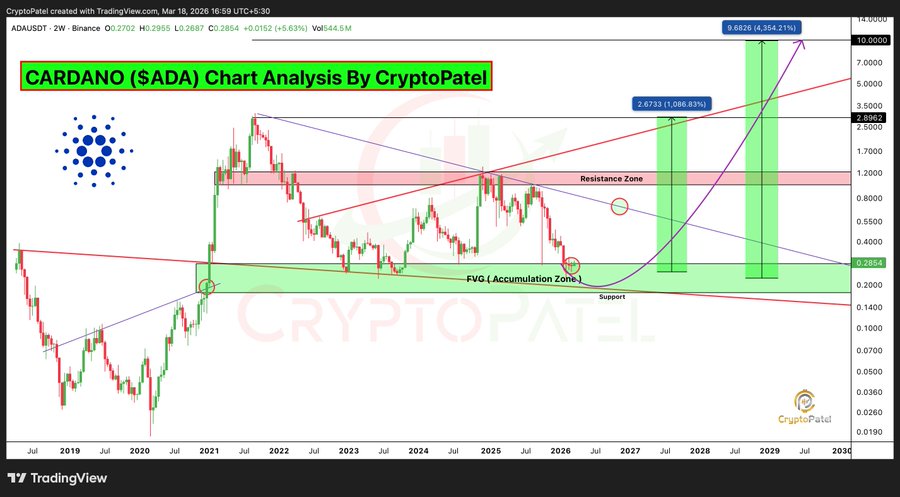
Notably, this region is not just a random support band. It aligns with what appears to be a fair-value gap and historical demand, with buyers consistently stepping in to absorb selling pressure.
The repeated defense of this area suggests that the market may be building a base. Historical data backs this too, as Cardano has usually formed a bottom around this area and bounced considerably from there.
An example was the accumulation zone fueling further price rallies for $ADA in January 2021. At the time, it was a resistance zone, but the asset held nicely above it, paving the way for a sustained uptrend to its cycle peak of $3.10.
Another instance was during the 2023 bear market. The coin tested this zone, reaching a low of $0.220 in June 2023. However, the strong demand around the accumulation zone cushioned price weakness and, subsequently, supported a recovery to $1.32 in December 2024.
A Long-Term Base Still Holding
Looking at the broader structure, Cardano has spent an extended period moving sideways after its previous cycle peak of $1.32. In February, it dropped to $0.2205, but rekindled buying pressure saw it hold the accumulation zone. $ADA’s price has since consolidated within this multi-year support, suggesting it could be forming another bottom.
Meanwhile, the accompanying chart also highlights a descending resistance line that has capped upside attempts in recent years. The trendline began forming after the 2021 $ATH and has kept the asset below it.
However, its price is now compressing between this resistance and the multi-year support zone, creating a tightening structure that typically precedes a larger move. As long as the lower range continues to hold, the broader framework remains intact.
Path Toward Higher Cardano Prices
If the current base continues to hold and $ADA eventually clears the descending resistance, the analyst suggests a sequence of higher targets that could come into play. The first area of interest sits near $1, representing a 270% increase from the current market price of $0.271
The following broader range sits 1,011% away around $3, which aligns closely with an area of strong resistance near the 2021 peak. Beyond that, the structure leaves room for a more extended move, with projections pointing toward a 1,751% uptick to $5 under favorable conditions.
However, the key factor remains the reaction at support. A sustained hold within the accumulation zone keeps the long-term structure intact, while a loss of this range would weaken the current bullish outlook.


