
Pi Network bucks crypto market crash as major mainnet upgrade fuels hype

Pi Network price managed to brush off the bearish sentiment prevailing in the broader crypto market amid a major mainnet upgrade that introduced smart contract functionality to the Pi ecosystem.
- Pi Network price held steady near $0.177 after a brief drop, defying a broader crypto market downturn despite remaining nearly 40% below its post-listing high.
- The resilience followed the rollout of mainnet version 20, which introduced smart contract capabilities and boosted expectations for ecosystem growth.
- Technical indicators remain bearish, with PI trading below key moving averages and facing downside risk if support near $0.176 fails.
According to data from crypto.news, Pi Network (PI) price initially fell 5% to an intraday low of $0.171 on March 19 before recouping from its losses and edging higher to $0.177 at press time. The token, however, remains nearly 40% lower than its high, which it attained following its highly anticipated listing on crypto exchange Kraken.
Pi Network’s resilience amidst the sectorwide downturn can be attributed to hype surrounding its mainnet upgrade to version 20. The latest upgrade brings the ability to support smart contracts to the network. This means developers can now build decentralized applications and other services on the platform, which could ultimately drive development and adoption of the Pi ecosystem.
In a March 19 X post, Pi developers also revealed that version 21 of the protocol would soon be rolled out. They instructed node operators to ensure their systems are up to date and to wait for more detailed instructions.
Major announcements such as these tend to boost investor demand for the token and thus add upward pressure on its price.
The latest upgrade follows a series of protocol updates that began on Feb. 20, when the team rolled out its first upgrade of the year to version 19.6.
Pi network price analysis
Despite the bullish development for the Pi ecosystem, charts seem to present a bearish outlook for the Pi token for the upcoming sessions.
On the daily chart, Pi Network price has fallen below the 50, 100, and 200-day moving averages, a sign that the long-term trend has shifted decisively in favor of sellers. The only exception was the 20-day SMA at $0.176, which stands as the final line of support preventing a deeper slide into bearish territory.
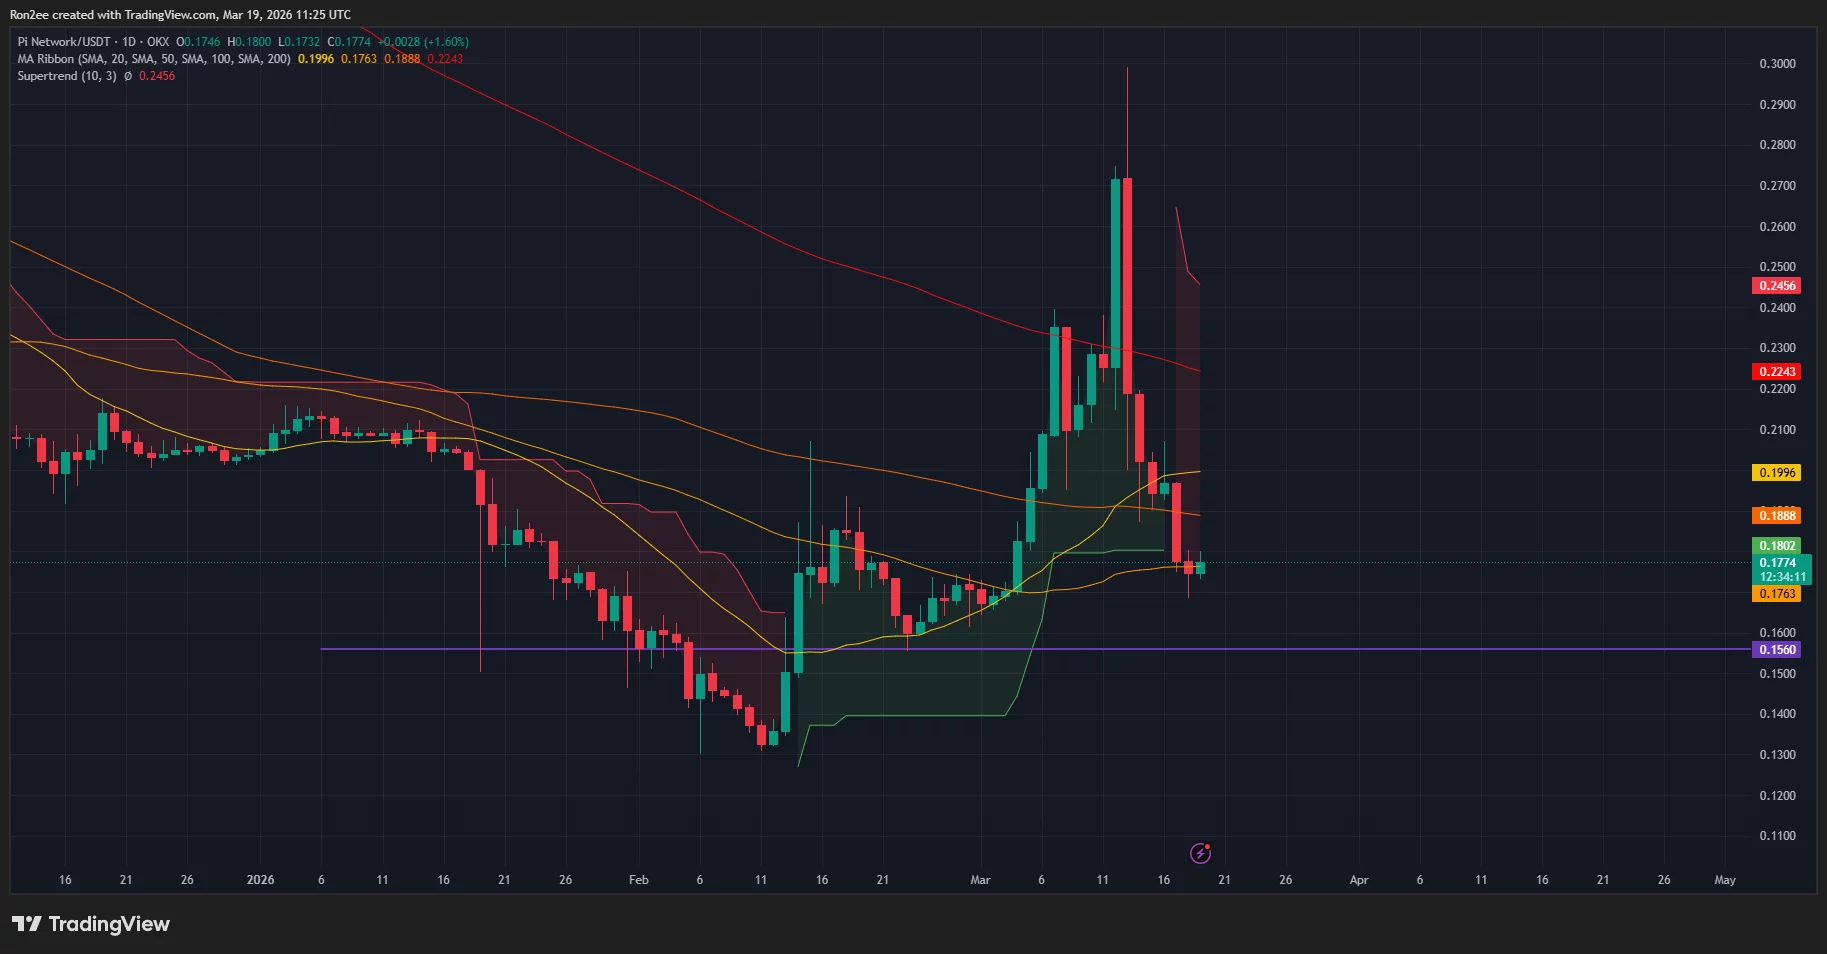 Pi Network price and Supertrend chart — March 19 | Source:
As PI price fell, it flipped the Supertrend indicator red, which means the market bias has turned negative and volatility is now working against the bulls. Furthermore, the MACD lines have pointed downwards, which indicates that bears have seized dominance over the price action, and momentum is currently favoring further downside.
For now, $0.176 is the most important support level to keep an eye on. A drop below this could instill confidence in bears to push prices down to the Feb 23 low of $0.156. However, a break above the $0.200 psychological resistance would invalidate the bearish forecast and potentially signal a trend reversal.
Disclaimer: The content of this article solely reflects the author's opinion and does not represent the platform in any capacity. This article is not intended to serve as a reference for making investment decisions.
You may also like
VALERO ENERGY CORP <VLO.N>: JEFFERIES CUTS TARGET PRICE TO $394 FROM $401
VALERO ENERGY CORP : JEFFERIES CUTS TARGET PRICE TO $394 FROM $401
Gold prices rise Rs 1,500/10g; silver up Rs 3,100/kg ahead of US economic data, softer yields. Buy, sell or hold?
The Shopify Stock Rally Isn't Done: Chart of the Week -- Barrons.com
By Doug Busch Shopify is no longer a pandemic-era growth story that simply failed to slow down. It is compounding at a pace few software platforms its size still manage. In the second quarter of 2026, sales on its platform rose 32%. That was the fifth straight quarter of growth exceeding 30%. Merchants are also using more of Shopify's own tools, from payments to Shop Pay, and new channels like AI shopping agents are starting to increase demand. The simple bull case is that the stock already commands a huge share of independent online commerce, and that position should become more valuable as more buying moves through its checkout. A rule of market mechanics is that the vast majority of an individual security's gain is driven by its underlying sector. Within technology, software has staged a robust recovery, joining semiconductors to power the broader sector higher. The iShares Expanded Tech-Software Sector ETF has maintained an upward trajectory since its mid-April lows, though the advance from $74 to $112 has been choppy as bulls repeatedly stepped in to defend when necessary. Breadth across large-cap software has expanded significantly, with 24 constituents surging over 20% over the past three months. During that same three-month window, Shopify generated outstanding relative strength, advancing 36%, more than doubling the IGV's 17% gain over the same period. Expect the stock's outperformance to persist as software momentum broadens. Let's examine the daily and monthly charts to outline the technical drivers behind this thesis. Looking at the daily chart, the ratio chart against the IGV shows persistent outperformance extending back to mid-May. The stock is riding an eight-session winning streak, during which price action cleared a double-bottom-with-handle pivot at $151.39. Within this broader base, the stock recorded a bullish golden cross in late August and successfully filled its Sept. 10 price gap, tracing back to its Aug. 4 session, the day before a powerful earnings reaction sent the stock surging 17% hi
Crypto prices
More


