Bitget App
Trade smarter
Buy cryptoMarketsTradeFuturesStocksEarnInstitutionAI & More
BTC falls into a high-risk, high-opportunity buying zone

BTC falls into a high-risk, high-opportunity buying zone

CryptopolitanCryptopolitan2026/03/19 11:07
By:Cryptopolitan

BTC has entered a zone of high-risk buying opportunities. The AHR999 index dropped to levels not seen since 2023, signaling a potential high-risk entry point into BTC. 

BTC hovers around the $70,000 range, entering a zone of high-risk buying. The AHR999 index signals BTC is now receiving a ‘buy’ signal, but with a strong risk warning.

Traders note the index levels of 0.45 points are not direct investment advice, but point to historical inflection points where BTC expanded from local lows. The index level has flashed BTC buy signals only rarely, coinciding with local market lows, but not always with immediate recoveries.
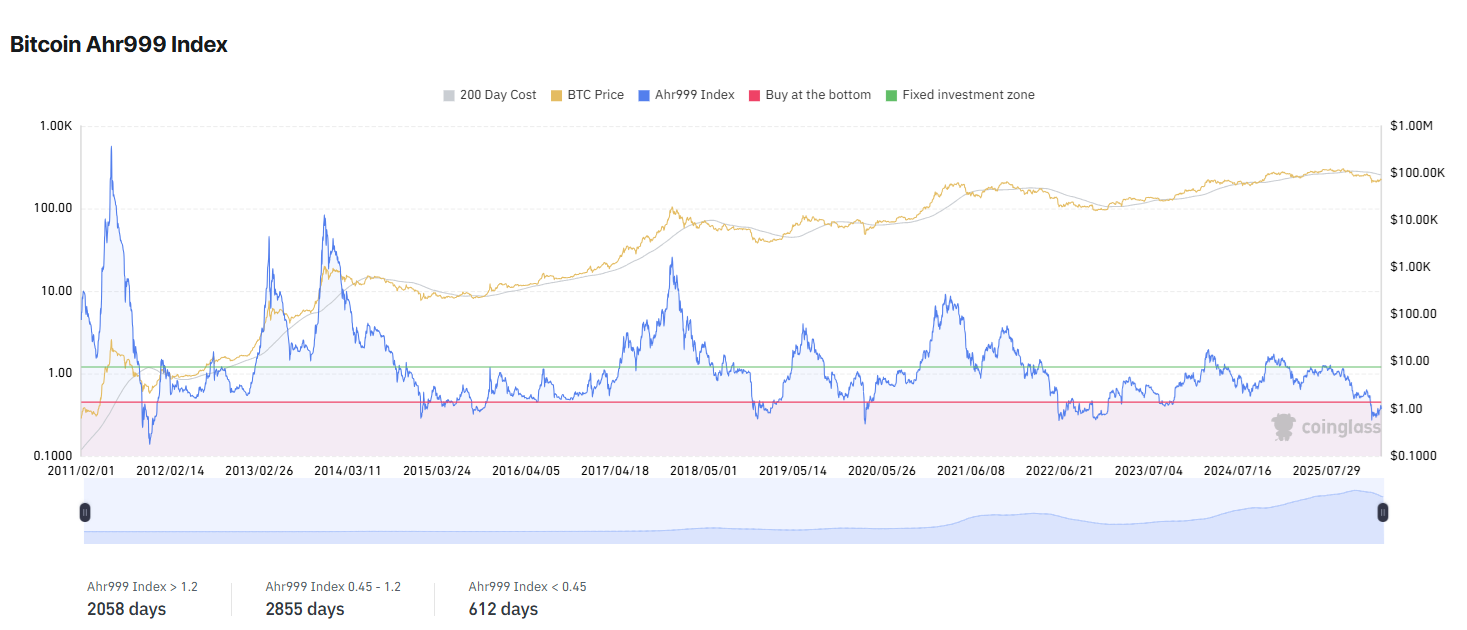
BTC falls into a high-risk, high-opportunity buying zone image 0 The AHR999 index points to opportunities where BTC trades with maximum uncertainty and offers a potential high-risk, high-reward opportunity. | Source:

The AHR999 index is a relatively obscure metric, created by Weibo user named ahr999. The metric directly targets timing strategies on BTC, mostly attempting to tap short-term returns. When the index breaks below 0.45, it is a rough gauge that the BTC price is relatively low. 

When the index moves between 0.45 and 1.2, the price is moving into accumulation mode. 

Is BTC still risky to buy? 

The index has fallen into the ‘buy’ zone during times when the crypto market had almost lost its appeal. One of those periods was during the 2022 bear market. 

The index does not guarantee a bounce, and only advices to buy near local lows. At this level, BTC may still trade with volatility or spend some time in sideways, choppy price moves. 

Additionally, previous periods came with vastly different geopolitical risks and levels of BTC adoption. Despite this, the index is a sign that BTC may always face an unexpected recovery, defying previous analysis. Previous index lows have seen BTC rally from $28,000 up to $72,000 within months.

For BTC, during periods of uncertainty, upside potential has always surpassed the risk of drawdowns. Currently, BTC is more widely held, and there are fewer risks of overall capitulation. Most of the rapid price drops are linked to derivative markets and partial forced selling, rather than deliberately divesting wallets. 

BTC volatility persists

BTC volatility is at 2.19%, close to the higher range for the past six months. BTC sentiment remains near the extreme fear range, showing traders are still afraid to make directional bets. 

BTC is now 158 days away from its all-time peak, down 41.8% from its record levels. The price drop since October 2025 has extended, with no signs of a fast recovery. Despite this, BTC held onto the $70,000 price range, with continued ETF buying and whale accumulation. 

Long-term holders have also slowed down their selling, and the market seems to be in a waiting mode, expecting an eventual breakout. 

During the riskier period, retail investors were also taking the lead against institutions. While large-scale whales and institutions tried to cut their losses, retail attempted to buy the dip, and was the main source of BTC investment in the past five months.

0
0

Disclaimer: The content of this article solely reflects the author's opinion and does not represent the platform in any capacity. This article is not intended to serve as a reference for making investment decisions.

Understand the market, then trade.
Bitget offers one-stop trading for cryptocurrencies, stocks, and gold.
Trade now!

You may also like

VALERO ENERGY CORP <VLO.N>: JEFFERIES CUTS TARGET PRICE TO $394 FROM $401

VALERO ENERGY CORP : JEFFERIES CUTS TARGET PRICE TO $394 FROM $401

Reuters•2026/10/09 04:52

The Shopify Stock Rally Isn't Done: Chart of the Week -- Barrons.com

By Doug Busch Shopify is no longer a pandemic-era growth story that simply failed to slow down. It is compounding at a pace few software platforms its size still manage. In the second quarter of 2026, sales on its platform rose 32%. That was the fifth straight quarter of growth exceeding 30%. Merchants are also using more of Shopify's own tools, from payments to Shop Pay, and new channels like AI shopping agents are starting to increase demand. The simple bull case is that the stock already commands a huge share of independent online commerce, and that position should become more valuable as more buying moves through its checkout. A rule of market mechanics is that the vast majority of an individual security's gain is driven by its underlying sector. Within technology, software has staged a robust recovery, joining semiconductors to power the broader sector higher. The iShares Expanded Tech-Software Sector ETF has maintained an upward trajectory since its mid-April lows, though the advance from $74 to $112 has been choppy as bulls repeatedly stepped in to defend when necessary. Breadth across large-cap software has expanded significantly, with 24 constituents surging over 20% over the past three months. During that same three-month window, Shopify generated outstanding relative strength, advancing 36%, more than doubling the IGV's 17% gain over the same period. Expect the stock's outperformance to persist as software momentum broadens. Let's examine the daily and monthly charts to outline the technical drivers behind this thesis. Looking at the daily chart, the ratio chart against the IGV shows persistent outperformance extending back to mid-May. The stock is riding an eight-session winning streak, during which price action cleared a double-bottom-with-handle pivot at $151.39. Within this broader base, the stock recorded a bullish golden cross in late August and successfully filled its Sept. 10 price gap, tracing back to its Aug. 4 session, the day before a powerful earnings reaction sent the stock surging 17% hi

Dow Jones•2026/10/09 03:10