
Bitget App
Trade smarter
Buy cryptoMarketsTradeFuturesStocksEarnInstitutionAI & More
Solana at a tipping point: will $96 breakout trigger the next rally?

Solana at a tipping point: will $96 breakout trigger the next rally?

CoinjournalCoinjournal2026/03/19 10:07
By:Coinjournal
Solana at a tipping point: will $96 breakout trigger the next rally? image 0
  • Institutional demand and ETFs are steadily supporting Solana’s outlook.
  • SOL’s price is consolidating, with $115 as a key breakout level to watch.
  • High liquidity and leverage may trigger sharp moves soon.

Solana (SOL) has entered a decisive phase where market structure and fundamentals are pulling in different directions.

The SOL price is currently hovering around the $89 level after a period of weakness, and it continues to show signs of building pressure beneath the surface.

This kind of setup often appears before a larger move, especially when liquidity and demand begin to align.

On , short-term volatility has been driven by profit-taking, shifting sentiment, and changes in leverage across derivatives markets.

At the same time, long-term signals are quietly improving in the background.

Institutional demand and regulatory clarity reshape the outlook

One of the strongest developments supporting Solana is the growing clarity around the regulatory treatment of proof-of-stake assets.

This shift has opened the door for structured financial products tied to Solana. It has also made it easier for institutional investors to participate without directly holding the asset.

The introduction and expansion of exchange-traded products have become a key driver of demand.

These products create a consistent inflow of capital that is less reactive to short-term price movements.

This type of demand tends to accumulate gradually and can support price over time, even during periods of weakness.

At the same time, Solana’s ecosystem continues to expand in meaningful ways.

Stablecoin liquidity on the network has reached record levels, which signals growing participation in decentralized finance (DeFi) and trading activity.

High stablecoin supply often indicates that capital is waiting on the sidelines, ready to deploy when conditions improve.

Derivatives markets are also playing a major role.

Solana’s open interest shows that traders are becoming more active and increasing their exposure.

This creates a more dynamic environment, but it also increases the likelihood of sharp price swings in either direction.

Technical analysis points toward a key breakout zone

From a technical perspective, Solana has been consolidating after a recent rejection near resistance.

The price action suggests that buyers and sellers are currently in balance, with neither side fully in control.

This type of consolidation often precedes a breakout when momentum eventually builds.

The $96.47 level stands out as a critical zone to watch since it represents a region where previous resistance has emerged, and a break above it could signal renewed bullish momentum.
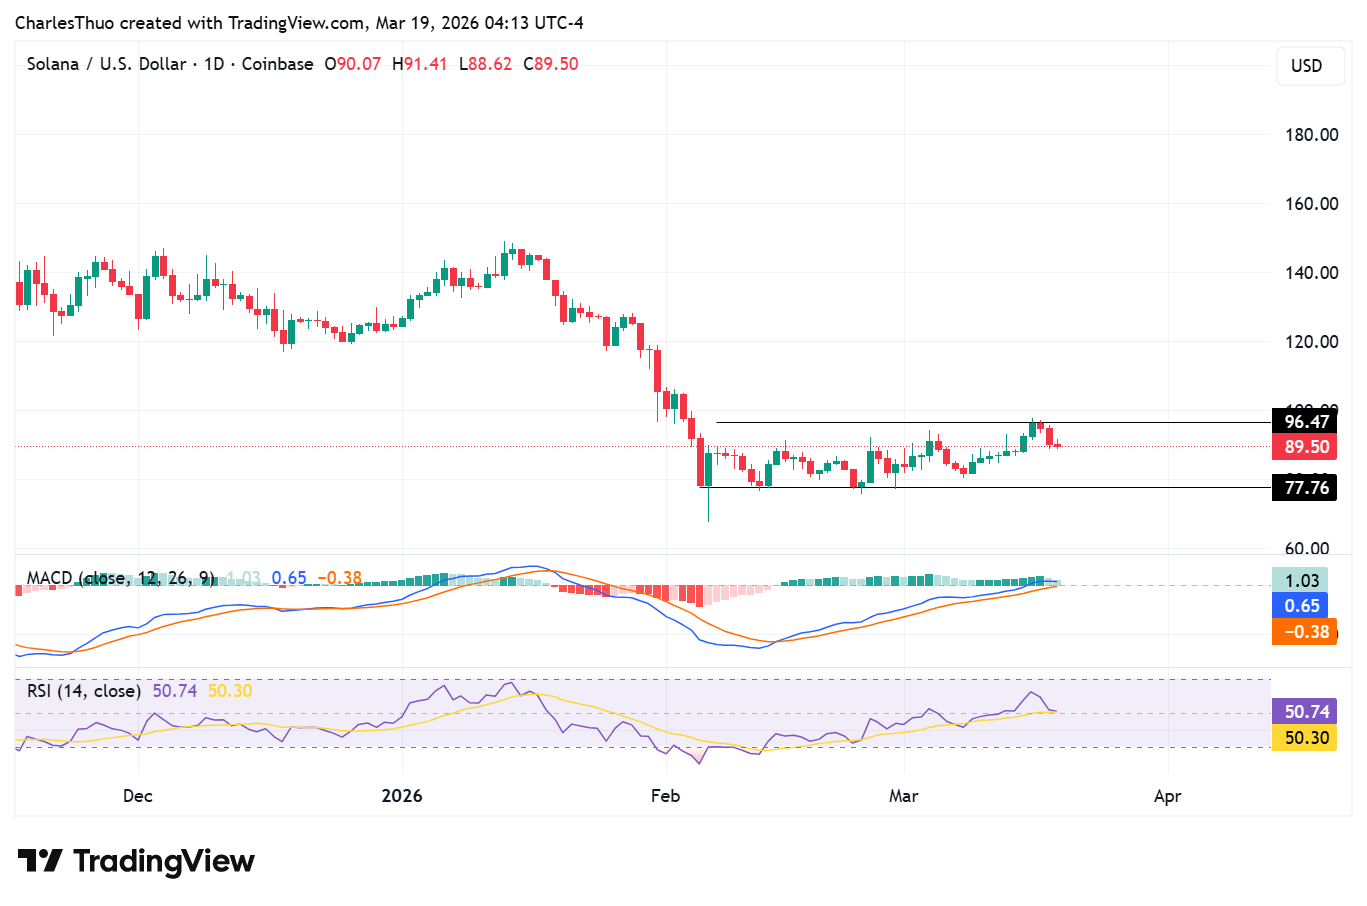
Solana at a tipping point: will $96 breakout trigger the next rally? image 1 Solana price chart | Source: TradingView

If Solana manages to close above this level with strong volume, it could open the door for a more sustained upward move.

On the downside, the immediate support sits around $77.

A failure to hold this zone could lead to further downside pressure and delay any breakout attempt.

0
0

Disclaimer: The content of this article solely reflects the author's opinion and does not represent the platform in any capacity. This article is not intended to serve as a reference for making investment decisions.

Understand the market, then trade.
Bitget offers one-stop trading for cryptocurrencies, stocks, and gold.
Trade now!

You may also like

VALERO ENERGY CORP <VLO.N>: JEFFERIES CUTS TARGET PRICE TO $394 FROM $401

VALERO ENERGY CORP : JEFFERIES CUTS TARGET PRICE TO $394 FROM $401

Reuters•2026/10/09 04:52

The Shopify Stock Rally Isn't Done: Chart of the Week -- Barrons.com

By Doug Busch Shopify is no longer a pandemic-era growth story that simply failed to slow down. It is compounding at a pace few software platforms its size still manage. In the second quarter of 2026, sales on its platform rose 32%. That was the fifth straight quarter of growth exceeding 30%. Merchants are also using more of Shopify's own tools, from payments to Shop Pay, and new channels like AI shopping agents are starting to increase demand. The simple bull case is that the stock already commands a huge share of independent online commerce, and that position should become more valuable as more buying moves through its checkout. A rule of market mechanics is that the vast majority of an individual security's gain is driven by its underlying sector. Within technology, software has staged a robust recovery, joining semiconductors to power the broader sector higher. The iShares Expanded Tech-Software Sector ETF has maintained an upward trajectory since its mid-April lows, though the advance from $74 to $112 has been choppy as bulls repeatedly stepped in to defend when necessary. Breadth across large-cap software has expanded significantly, with 24 constituents surging over 20% over the past three months. During that same three-month window, Shopify generated outstanding relative strength, advancing 36%, more than doubling the IGV's 17% gain over the same period. Expect the stock's outperformance to persist as software momentum broadens. Let's examine the daily and monthly charts to outline the technical drivers behind this thesis. Looking at the daily chart, the ratio chart against the IGV shows persistent outperformance extending back to mid-May. The stock is riding an eight-session winning streak, during which price action cleared a double-bottom-with-handle pivot at $151.39. Within this broader base, the stock recorded a bullish golden cross in late August and successfully filled its Sept. 10 price gap, tracing back to its Aug. 4 session, the day before a powerful earnings reaction sent the stock surging 17% hi

Dow Jones•2026/10/09 03:10