
Bitget App
Trade smarter
Buy cryptoMarketsTradeFuturesStocksEarnInstitutionAI & More
XRP Correction Masks Bullish Momentum as Regulation Clarity and Macro Pressure Collide

XRP Correction Masks Bullish Momentum as Regulation Clarity and Macro Pressure Collide

CryptoNewsNetCryptoNewsNet2026/03/18 20:09
By:CryptoNewsNet
Back to the list

XRP Correction Masks Bullish Momentum as Regulation Clarity and Macro Pressure Collide

XRP Correction Masks Bullish Momentum as Regulation Clarity and Macro Pressure Collide image 0  53 m
XRP Correction Masks Bullish Momentum as Regulation Clarity and Macro Pressure Collide image 1

$XRP declines after a failed breakout, even as landmark regulatory recognition of its non-security status strengthens the broader bullish case, highlighting a disconnect between short-term price pressure and improving long-term crypto fundamentals.

$XRP Drops Below Key Levels as Selling Pressure Builds

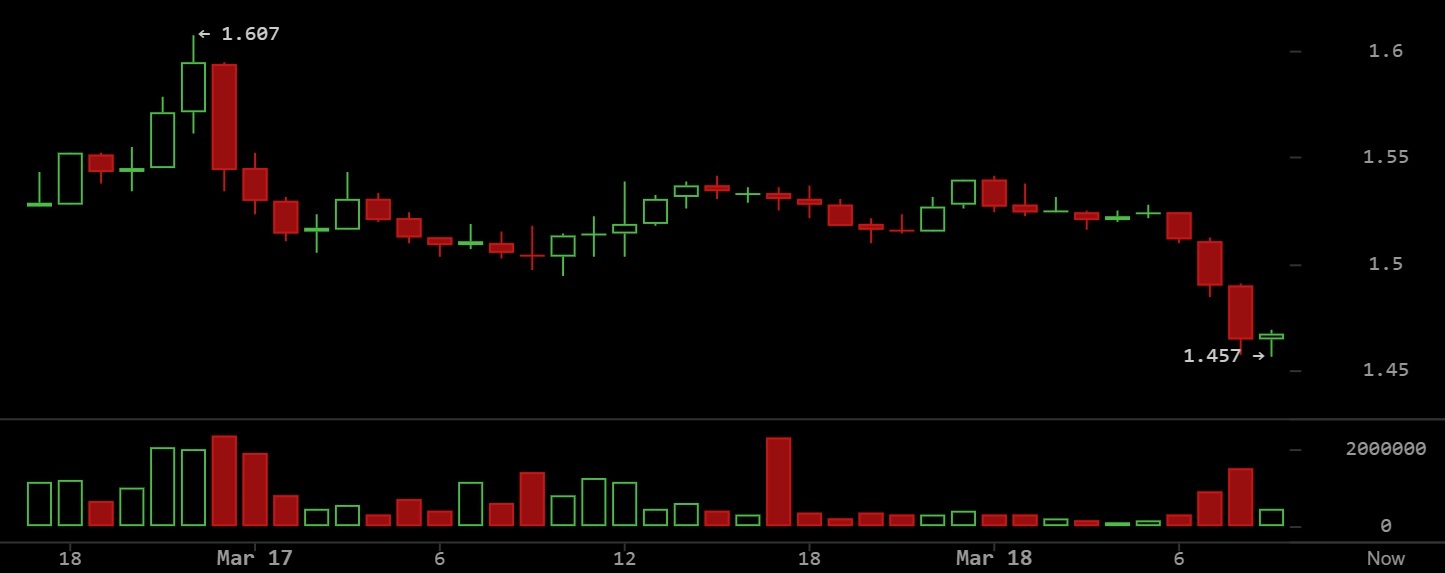
At 10:08 a.m., $XRP is trading at $1.46758, extending its decline as selling pressure accelerates into the lower end of the recent range. The crypto asset is down 2.66% over the past 24 hours, with price retreating from a session high near $1.54 and failing to hold above the $1.50 level. The latest candles show continued downside follow-through, with $XRP hovering just above recent intraday lows after a sharp rejection from higher prices.

From a short-term perspective, $XRP’s structure reflects a clear shift from bullish momentum into a corrective phase. After breaking above $1.50 earlier, the rally stalled and reversed, leading to a sequence of lower highs and increasing bearish control. Price is now trading below the 14-period Moving Average (MA) at $1.51261 and the 21-period MA at $1.51852, both of which now act as resistance. Bollinger Bands have widened, with the lower band near $1.47763 being tested as price pushes downward, while the upper band near $1.55817 marks the recent rejection zone. Volume expanded during the sell-off and remains elevated, suggesting conviction behind the current move lower rather than a brief pullback.
XRP Correction Masks Bullish Momentum as Regulation Clarity and Macro Pressure Collide image 2
$XRP 1-hour chart on March 18 via Bitstamp.

The downward movement aligns with a combination of macroeconomic tension and structural shifts impacting sentiment. Markets are reacting to hotter-than-expected U.S. Producer Price Index data released this morning, which showed inflation running above forecasts and reinforced expectations that the Federal Reserve may keep interest rates higher for longer. At the same time, geopolitical tensions in the Middle East and uncertainty around key shipping routes have added to risk-off positioning across financial markets.

Adding to the evolving regulatory backdrop, U.S. regulators have formally recognized $XRP’s non-security status within a newly established joint framework between the Securities and Exchange Commission (SEC) and the Commodity Futures Trading Commission (CFTC), marking a notable shift in how digital assets are being categorized at the federal level. The development represents one of the clearest acknowledgments to date that certain tokens may fall outside traditional securities definitions, potentially reducing long-standing legal ambiguity surrounding $XRP. However, the market response has remained cautious, as traders await more definitive, binding legislation before pricing in the impact.

Technical indicators reinforce the bearish momentum now in place. The Relative Strength Index ( RSI) has fallen to 29.62, entering oversold territory and indicating that selling pressure has reached an extreme in the short term. The Moving Average Convergence Divergence ( MACD) remains negative, with the MACD line around -0.00722 and the signal line near -0.00879, while the histogram at approximately -0.00156 shows continued downside momentum. These signals align with the broader trend, where price remains below key moving averages and continues to press along the lower Bollinger Band.

If $XRP can stabilize near the current $1.46–$1.47 region and reclaim the lower Bollinger Band, a relief bounce toward the $1.51–$1.52 resistance zone may develop. However, failure to hold this area would confirm continued weakness, with further downside likely if selling pressure persists and volume remains elevated.

FAQ 🧭

  • Why is $XRP price falling right now?
    Rising inflation data and risk-off sentiment are driving selling pressure across crypto markets.
  • What key levels should investors watch for $XRP?
    Support near $1.46 and resistance around $1.51–$1.52 are critical short-term levels.
  • Does $XRP’s regulatory status change impact its price?
    Recognition as a non-security is positive long-term but not yet fully priced in.
  • Is $XRP oversold and due for a rebound?
    RSI signals oversold conditions, suggesting a possible short-term bounce if support holds.
0
0

Disclaimer: The content of this article solely reflects the author's opinion and does not represent the platform in any capacity. This article is not intended to serve as a reference for making investment decisions.

Understand the market, then trade.
Bitget offers one-stop trading for cryptocurrencies, stocks, and gold.
Trade now!

You may also like

The Shopify Stock Rally Isn't Done: Chart of the Week -- Barrons.com

By Doug Busch Shopify is no longer a pandemic-era growth story that simply failed to slow down. It is compounding at a pace few software platforms its size still manage. In the second quarter of 2026, sales on its platform rose 32%. That was the fifth straight quarter of growth exceeding 30%. Merchants are also using more of Shopify's own tools, from payments to Shop Pay, and new channels like AI shopping agents are starting to increase demand. The simple bull case is that the stock already commands a huge share of independent online commerce, and that position should become more valuable as more buying moves through its checkout. A rule of market mechanics is that the vast majority of an individual security's gain is driven by its underlying sector. Within technology, software has staged a robust recovery, joining semiconductors to power the broader sector higher. The iShares Expanded Tech-Software Sector ETF has maintained an upward trajectory since its mid-April lows, though the advance from $74 to $112 has been choppy as bulls repeatedly stepped in to defend when necessary. Breadth across large-cap software has expanded significantly, with 24 constituents surging over 20% over the past three months. During that same three-month window, Shopify generated outstanding relative strength, advancing 36%, more than doubling the IGV's 17% gain over the same period. Expect the stock's outperformance to persist as software momentum broadens. Let's examine the daily and monthly charts to outline the technical drivers behind this thesis. Looking at the daily chart, the ratio chart against the IGV shows persistent outperformance extending back to mid-May. The stock is riding an eight-session winning streak, during which price action cleared a double-bottom-with-handle pivot at $151.39. Within this broader base, the stock recorded a bullish golden cross in late August and successfully filled its Sept. 10 price gap, tracing back to its Aug. 4 session, the day before a powerful earnings reaction sent the stock surging 17% hi

Dow Jones•2026/10/09 03:10

TRexBio: IPO Of 8.3M Shares Priced at $14.00 Each >TRXB

TRexBio: IPO Of 8.3M Shares Priced at $14.00 Each >TRXB

Dow Jones•2026/10/09 01:47

Talos Energy director Barbara J. Faulkenberry files initial beneficial ownership statement

Talos Energy director Barbara J. Faulkenberry filed an initial Form 3 statement dated Oct. 1, 2026. Disclaimer: This news brief was created by Public Technologies (PUBT) using generative artificial intelligence. While PUBT strives to provide accurate and timely information, this AI-generated content is for informational purposes only and should not be interpreted as financial, investment, or legal advice. Talos Energy Inc. published the original content used to generate this news brief via EDGAR, the Electronic Data Gathering, Analysis, and Retrieval system operated by the U.S. Securities and Exchange Commission (Ref. ID: 0001193125-26-418248), on October 08, 2026, and is solely responsible for the information contained therein.

Bitget•2026/10/09 01:05