

 thecryptobasic.com
$XRP has closed above a parallel channel and a symmetrical triangle pattern across multiple timeframes amid the ongoing uptrend.
$XRP has made a strong comeback, breaking above two important technical patterns across multiple timeframes. Specifically, on the 3-day chart, the price closed above a parallel channel, while on the daily chart, it closed above a symmetrical triangle. This confirms that momentum has changed in favor of the bulls.
Key Points
- $XRP recently broke above a parallel channel on the 3-day chart when it conquered the $1.51 level, after spending over a month trading within the structure.
- The $XRP price also pushed above a symmetrical triangle on the daily chart, representing a larger pattern that had been forming since $XRP fell from its $2.40 high on Jan. 6.
- To keep both breakouts valid amid the current pullback, $XRP must hold above $1.51 for the parallel channel and above $1.40 for the symmetrical triangle.
- If $XRP successfully defends both levels, analysts see $1.65 as the next upside target.
- The +DI on the daily DMI sits at 33.9 while the -DI stands at 22.59, confirming short-term bullish momentum, but the ADX indicates a weak trend.
$XRP Escapes Parallel Channel After Month-Long Consolidation
For context, the 3-day parallel channel that had kept $XRP’s price locked in a tight range since early February. The channel had an upper boundary at $1.51 and a lower boundary at around $1.34.
Notably, $XRP fell into this channel after dropping from $1.93 on Jan. 28 and spent over a month bouncing between these two levels before finally breaking out. During this period, the $1.51 level kept pushing the price back down each time bulls tried to break higher, while the $1.34 level absorbed every attempt by bears to drive the price lower.
Specifically, bulls made a run at the upper boundary between Feb. 12 and 15, when $XRP climbed from $1.36 to a high of $1.67 by Feb. 15, briefly clearing the $1.51 resistance. However, the move did not last, and $XRP soon fell back below $1.45 without managing a clean close above the channel.
After the failed attempt, bears took control from Feb. 24 to March 8 and repeatedly tried to push the price below the $1.34 support. Nonetheless, buyers stepped in each time, and the lower boundary held on every test.
The most recent recovery has now ended the bear campaign, with $XRP closing above the upper boundary. At the time of writing, $XRP changes hands at $1.52, holding above the channel even after pulling back from a recent high of $1.60.
$XRP Breaks Above Symmetrical Triangle
Meanwhile, the daily chart reveals an equally bullish development. On Monday, March 16, $XRP broke and closed above a symmetrical triangle during the ongoing rally.
This triangle represents a larger pattern that began forming after $XRP fell from its $2.41 high on Jan. 6. Throughout the triangle’s formation, $XRP never once pushed above its upper boundary, until this breakout.
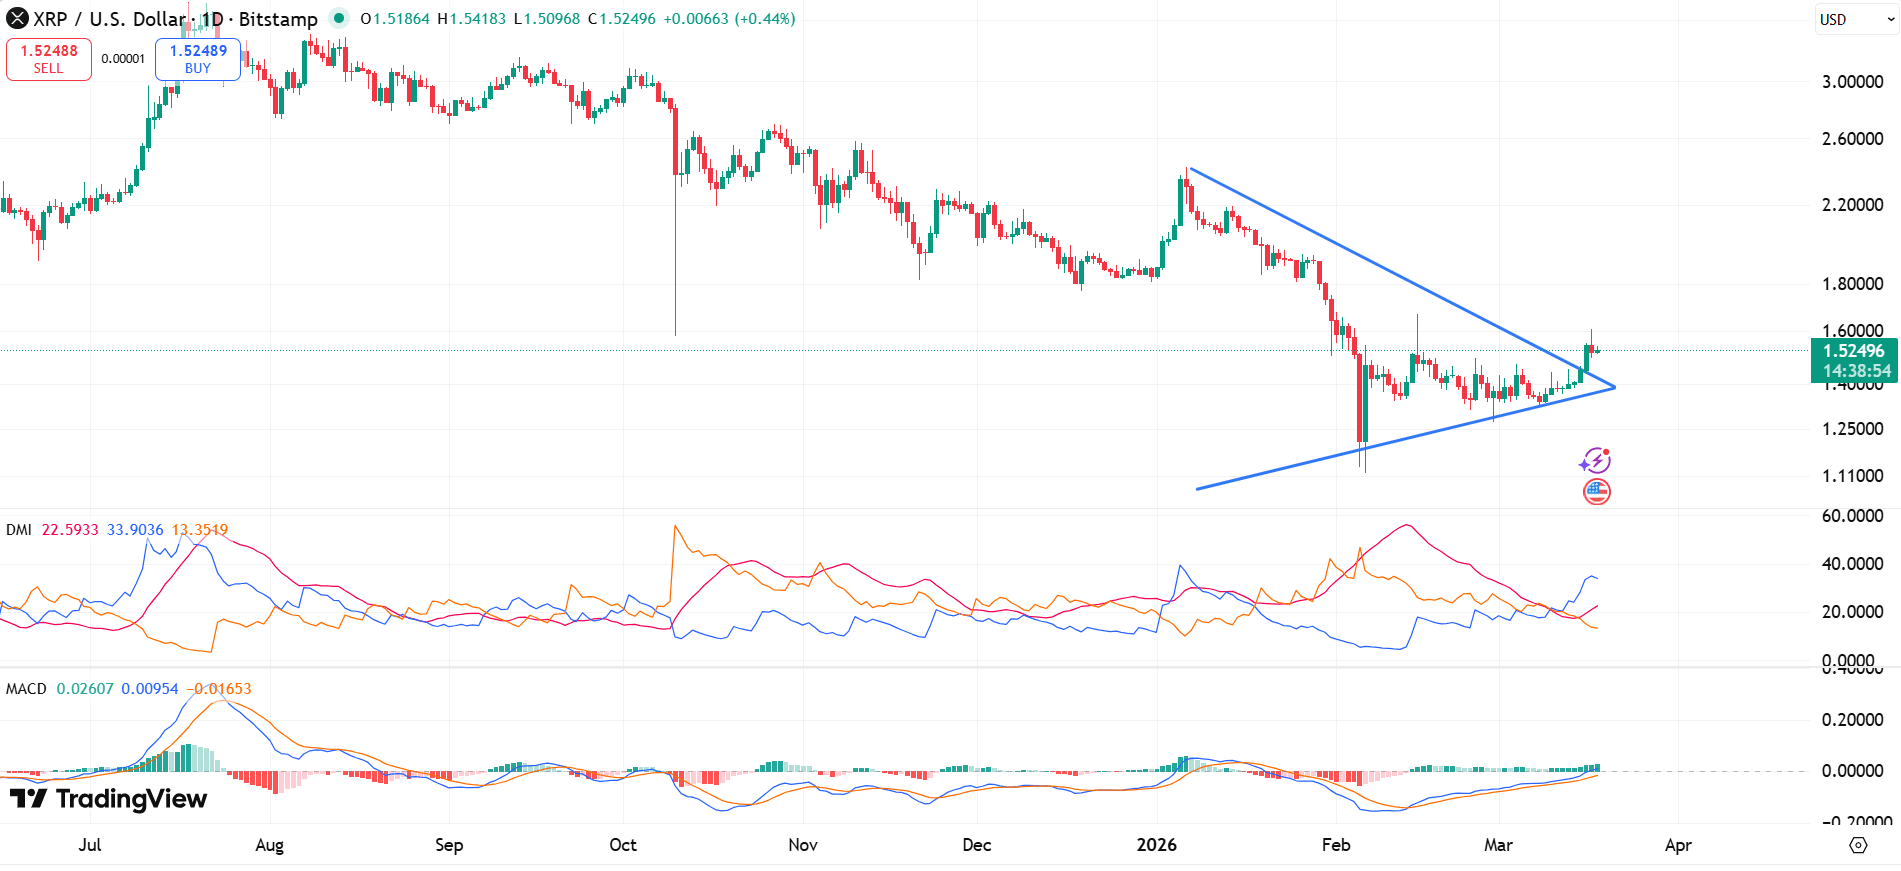
The lower boundary faced three downside tests instead, with the price dropping to $1.11 on Feb. 6, $1.27 on Feb. 28, and $1.32 on March 8. Buyers defended the lower boundary on all three occasions. The current rally marks the first time $XRP has broken upward out of this pattern, and the price still holds above the triangle at the time of writing.
What Comes Next?
Now that both breakouts are in place, the next test is whether $XRP can hold these levels as the pullback continues.
Notably, to keep the parallel channel breakout intact, the price needs to stay above $1.51. Meanwhile, to preserve the symmetrical triangle breakout, $XRP needs to hold above the triangle’s upper boundary, which currently sits near the $1.40 level.
If $XRP holds both breakouts, the rally that has recently stalled could pick up again and push the price toward higher targets. Specifically, several analysts, such as Casi, see $1.65 as the next level to watch if the bullish setup remains intact.
DMI Indicators Show Promise but Urge Caution
Elsewhere, the daily Directional Moving Index (DMI) shows the positive directional indicator (+DI) has been rising since March 9 and sits at 33.9 at the time of writing, while the negative directional indicator (-DI) dropped to 22.59. These readings indicate that short-term momentum has moved in favor of bulls.
However, the Average Directional Index currently reads 13.35, still well below the 25 mark needed to confirm a strong trend to the upside. For $XRP to sustain and build on its current push, the +DI needs to keep rising while the ADX climbs above 25. This would confirm the bullish trend has real strength behind it.


