
XRP Liquidations Accelerate After $1.50 Breakout: Short Squeeze Unfolds

XRP has reclaimed the $1.50 level as market activity accelerates and bullish momentum begins to build after weeks of consolidation. The move higher suggests that buyers are regaining control, with traders closely watching whether XRP can sustain this breakout and establish a stronger uptrend.

Beyond price action, derivatives data is revealing a notable shift in market behavior. According to a recent CryptoQuant report, multiple indicators are now signaling activity levels not seen in weeks, pointing to a renewed wave of participation across XRP markets.
In particular, the Multi-Exchange Open Interest Delta is showing clear signs of expansion. This metric tracks the net change in total open contracts across major derivatives platforms over a given period, offering insight into how traders are positioning.
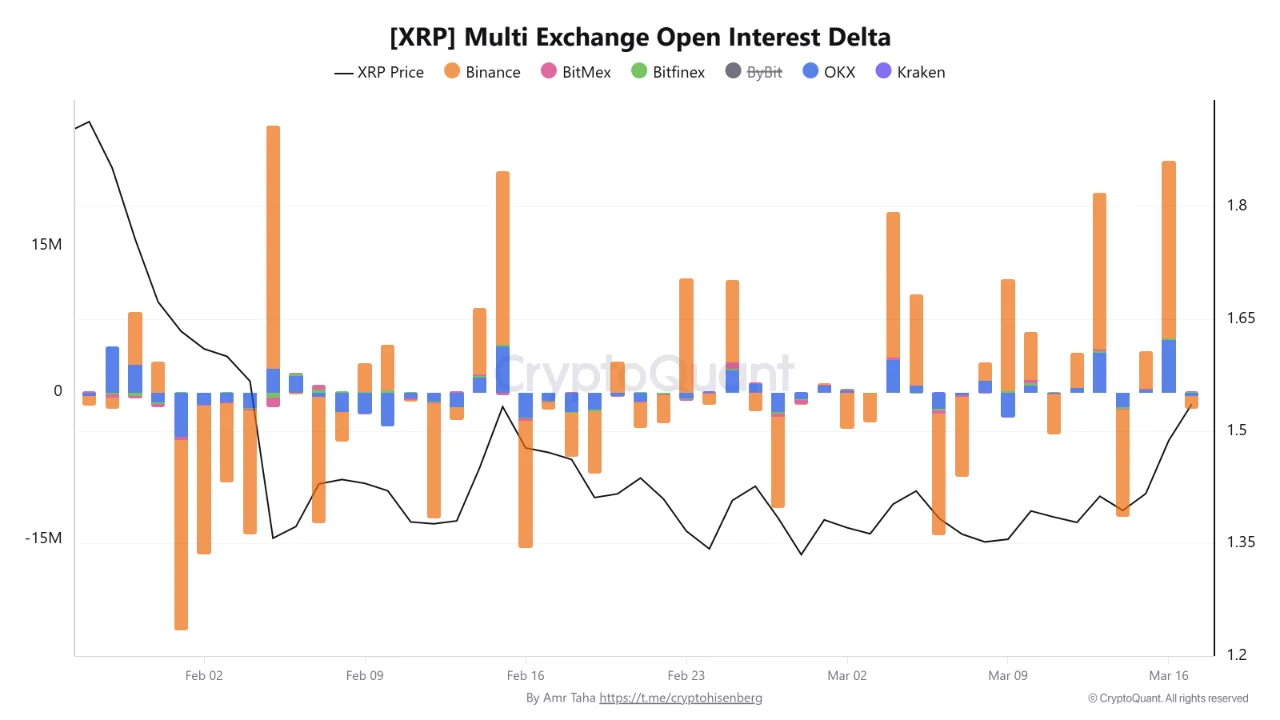 XRP Multi Exchange Open Interest Delta | Source:
A positive Open Interest Delta indicates that new positions are being opened, reflecting growing participation and capital inflows into the market. Conversely, a negative reading suggests that traders are closing positions, which typically signals reduced activity or risk-off behavior.
Recent data shows a sustained increase in open interest, suggesting that traders are actively entering the market rather than exiting. For analysts, this shift often signals rising conviction and increasing speculative interest, conditions that can support stronger price movements if accompanied by continued demand and favorable market structure.
Open Interest Surge and Liquidations Drive XRP Breakout Dynamics
The CryptoQuant report provides a broader perspective by tracking Open Interest Delta across six major derivatives exchanges, offering a comprehensive view of how traders are positioning in XRP. The data reveals two distinct waves of position building that preceded the recent breakout.
On March 13, open interest increased by approximately $16 million, followed by a second surge on March 16, where an additional $18 million in positions were opened. This sequence is structurally important, as it shows that traders were actively building exposure before XRP broke above the $1.50 level, marking the asset’s first return to this price zone since February 15.
At the same time, liquidation data highlights the impact of this positioning. XRP’s move above $1.50 forced significant liquidations on short positions, proving that the breakout caught many traders off guard.
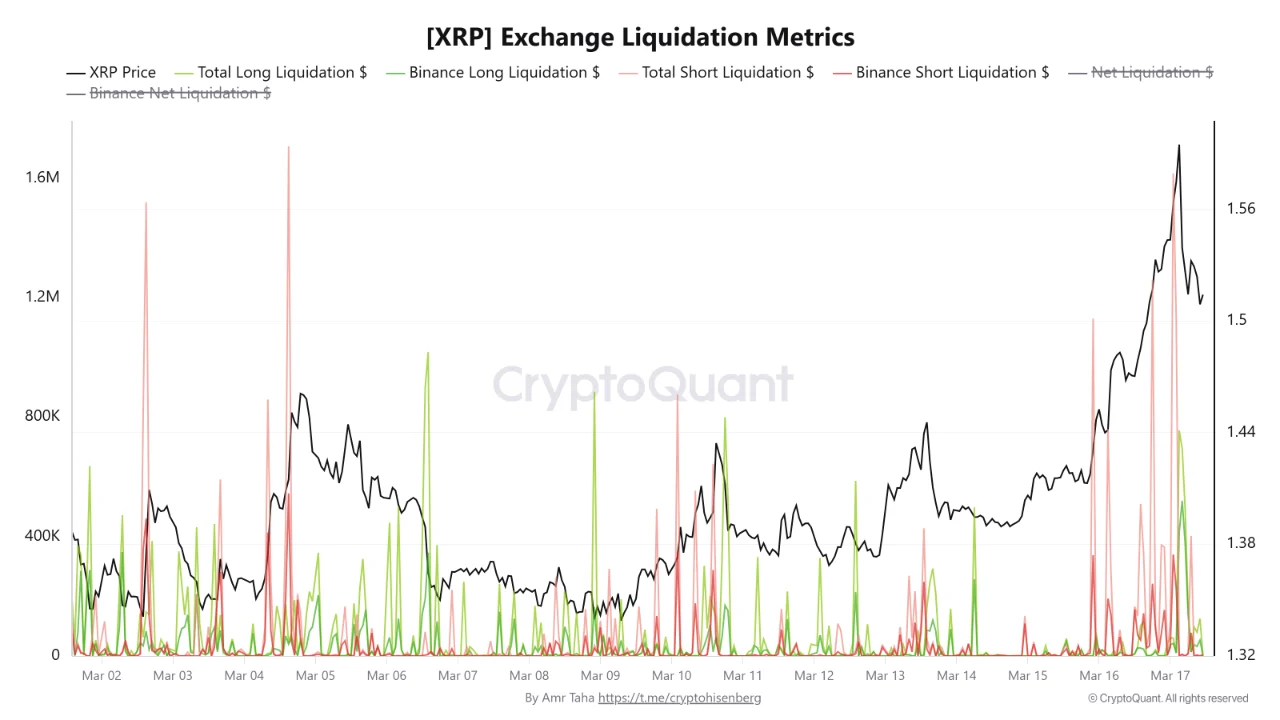 XRP Exchange Liquidation Metrics | Source:
The prior increase in open interest played a key role in this dynamic. Higher leverage across the market meant that once the price moved against short positions, forced liquidations accelerated the move, adding momentum and volatility.
This combination of pre-breakout positioning and post-breakout liquidations suggests that derivatives activity amplified XRP’s rally beyond spot demand, creating a feedback loop that intensified price action.

XRP Reclaims $1.50 but Faces Structural Resistance
The XRP 3-day chart shows the asset attempting to stabilize after a prolonged downtrend that began in late 2025. XRP is currently trading around $1.51, having recently reclaimed the $1.50 level, which now acts as a key short-term pivot for price direction.
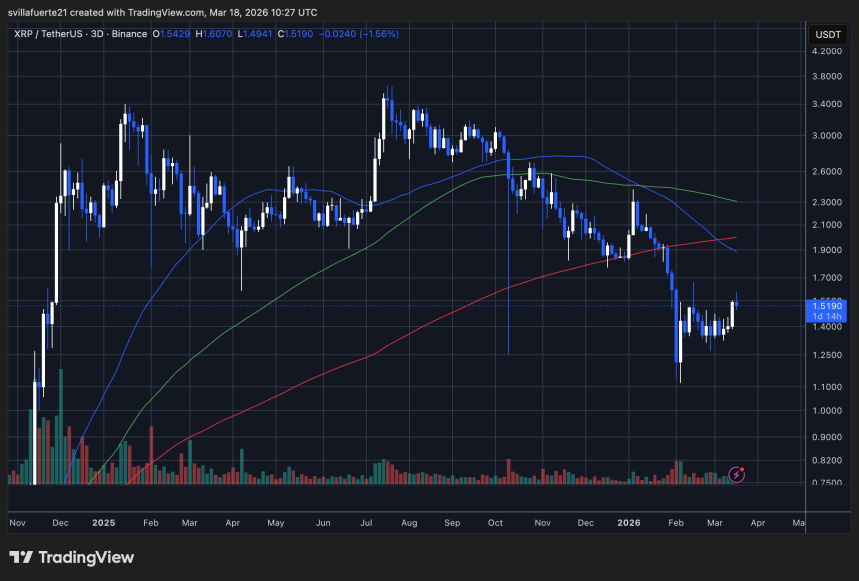 XRP testing critical resistance | Source:
The broader structure remains corrective. XRP continues to trade below the 50-, 100-, and 200-period moving averages, all of which are trending downward. The market’s current alignment reflects ongoing pressure as sellers frequently meet price rallies with heavy supply at higher levels.

However, the recent rebound from the $1.10–$1.20 region is technically significant. That zone marked a capitulation low, supported by a noticeable increase in volume, suggesting strong buyer absorption. Since then, XRP has formed a base between $1.30 and $1.45, gradually building momentum before pushing higher.
Reclaiming $1.50 indicates improving sentiment, but the asset now faces immediate resistance near $1.70, followed by a stronger barrier around $2.00, where previous consolidation and moving averages converge.
Volume during the recovery remains moderate, signaling that the move is still developing rather than driven by aggressive inflows.
Featured image from ChatGPT, chart from TradingView.com
Disclaimer: The content of this article solely reflects the author's opinion and does not represent the platform in any capacity. This article is not intended to serve as a reference for making investment decisions.
You may also like
The Shopify Stock Rally Isn't Done: Chart of the Week -- Barrons.com
By Doug Busch Shopify is no longer a pandemic-era growth story that simply failed to slow down. It is compounding at a pace few software platforms its size still manage. In the second quarter of 2026, sales on its platform rose 32%. That was the fifth straight quarter of growth exceeding 30%. Merchants are also using more of Shopify's own tools, from payments to Shop Pay, and new channels like AI shopping agents are starting to increase demand. The simple bull case is that the stock already commands a huge share of independent online commerce, and that position should become more valuable as more buying moves through its checkout. A rule of market mechanics is that the vast majority of an individual security's gain is driven by its underlying sector. Within technology, software has staged a robust recovery, joining semiconductors to power the broader sector higher. The iShares Expanded Tech-Software Sector ETF has maintained an upward trajectory since its mid-April lows, though the advance from $74 to $112 has been choppy as bulls repeatedly stepped in to defend when necessary. Breadth across large-cap software has expanded significantly, with 24 constituents surging over 20% over the past three months. During that same three-month window, Shopify generated outstanding relative strength, advancing 36%, more than doubling the IGV's 17% gain over the same period. Expect the stock's outperformance to persist as software momentum broadens. Let's examine the daily and monthly charts to outline the technical drivers behind this thesis. Looking at the daily chart, the ratio chart against the IGV shows persistent outperformance extending back to mid-May. The stock is riding an eight-session winning streak, during which price action cleared a double-bottom-with-handle pivot at $151.39. Within this broader base, the stock recorded a bullish golden cross in late August and successfully filled its Sept. 10 price gap, tracing back to its Aug. 4 session, the day before a powerful earnings reaction sent the stock surging 17% hi
TRexBio: IPO Of 8.3M Shares Priced at $14.00 Each >TRXB
TRexBio: IPO Of 8.3M Shares Priced at $14.00 Each >TRXB
Talos Energy director Barbara J. Faulkenberry files initial beneficial ownership statement
Talos Energy director Barbara J. Faulkenberry filed an initial Form 3 statement dated Oct. 1, 2026. Disclaimer: This news brief was created by Public Technologies (PUBT) using generative artificial intelligence. While PUBT strives to provide accurate and timely information, this AI-generated content is for informational purposes only and should not be interpreted as financial, investment, or legal advice. Talos Energy Inc. published the original content used to generate this news brief via EDGAR, the Electronic Data Gathering, Analysis, and Retrieval system operated by the U.S. Securities and Exchange Commission (Ref. ID: 0001193125-26-418248), on October 08, 2026, and is solely responsible for the information contained therein.
Crypto prices
More


