thecryptobasic.com
$XRP is quietly approaching a critical moment in its long-term structure, as recent price behavior suggests a rare formation may be nearing completion.
Notably, $XRP has shown bullish momentum over the past few days, rallying considerably to reach an over-one-month high of $1.60. While short-term volatility continues to dominate proceedings, a broader view of the chart reveals a pattern that has been developing over several months.
Key Points
- $XRP is quietly approaching a critical moment in its long-term structure, as recent price behavior suggests a rare formation may be nearing completion
- The current structure resembles a triple-bottom pattern spanning multiple phases within a broader ABC formation.
- The current phase is a corrective sequence, with prices gradually moving through what could be the final leg of this structure.
- A key area to watch sits near the $0.91 region, as it aligns with previous demand, a major Fibonacci retracement level, and the lower boundary of the broader structure.
- While the lower range defines potential support, the first sign of structural strength sits at the $1.65 price level.
- Reclaiming this level on a higher timeframe would suggest that $XRP has broken the descending structure.
$XRP Shapes Within Rare Multi-Cycle Structure
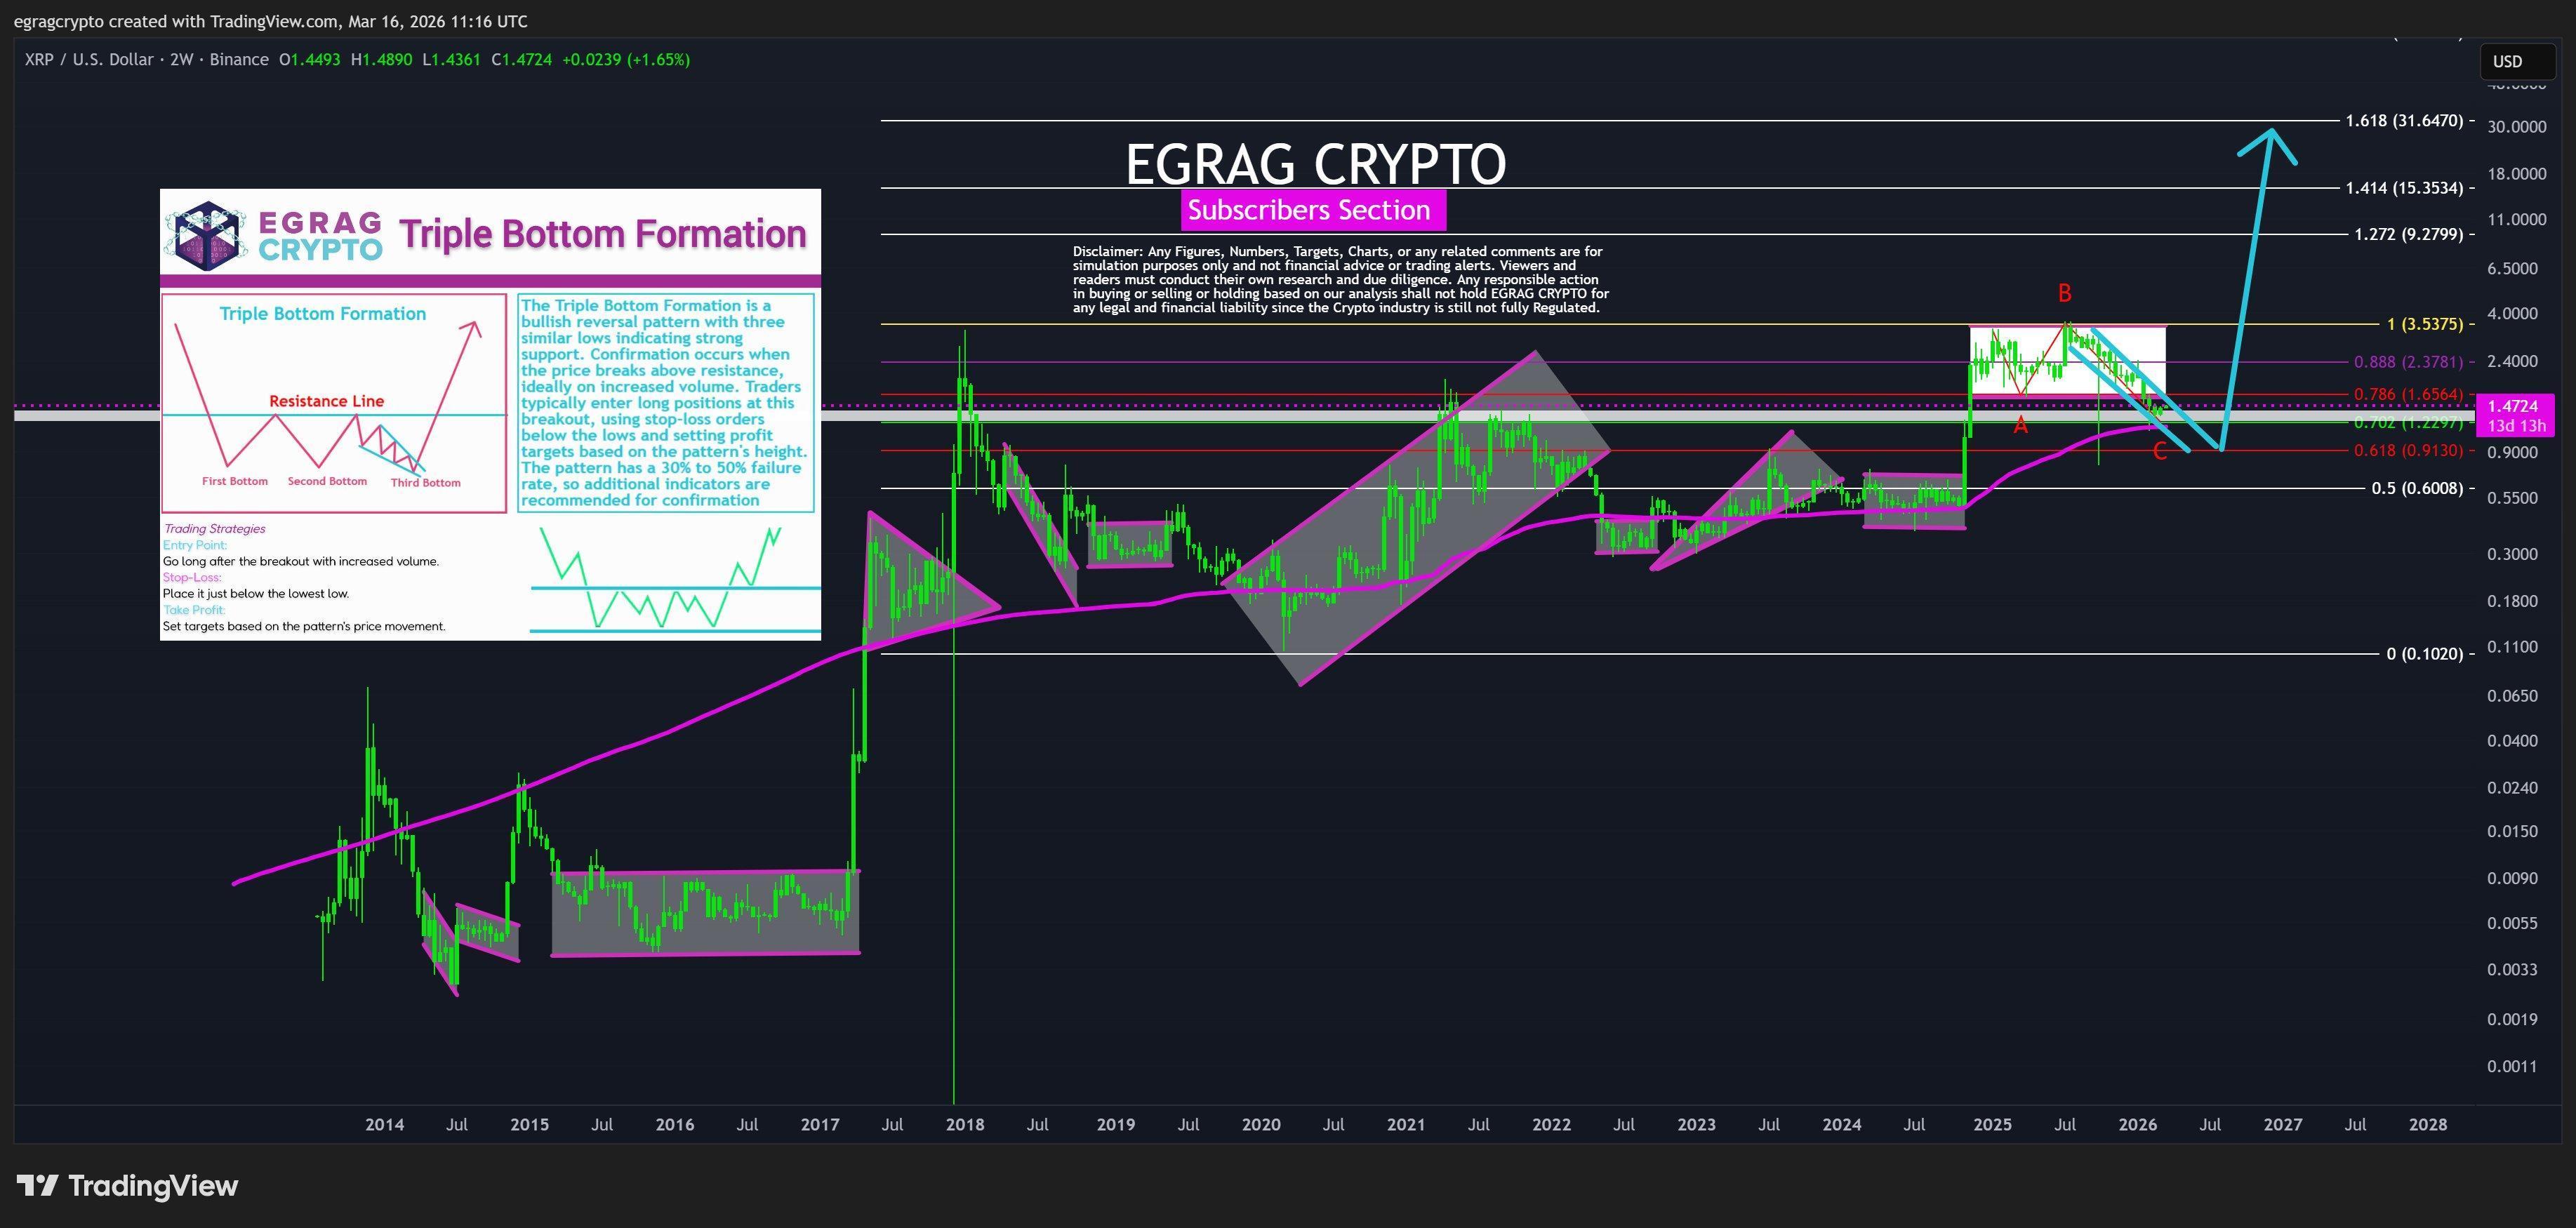
Market technician EGRAG Crypto highlighted that from a macro perspective, $XRP appears to be forming a multi-cycle base, with price repeatedly stabilizing at a similar price level before attempting to move higher. These types of formations tend to emerge over extended periods and often signal a transition phase.
When zoomed out, the current structure resembles a triple-bottom pattern spanning multiple phases. Each base reflects a period where selling pressure weakened and demand began to stabilize price action. Over time, this creates a foundation that can support a larger directional move if confirmed.
Meanwhile, EGRAG noted that $XRP appears to be nearing the final phase of this formation. The current phase is a corrective sequence, with price gradually moving through what could be the final leg of this structure. This has seen $XRP trade within a descending wedge in a broader ABC pattern.
For context, wave A formed when $XRP dropped from its January 2025 peak of $3.39 in January 2025 to $1.61 in April 2025. The B wave followed, pushing the coin back to its current ATH of $3.6 in July 2025. The final C wave is currently in play within the descending channel.
 $XRP Rare Multi-Cycle Formation/EGRAG Crypto">
Key Levels to Watch
According to EGRAG, a key area to watch sits near the $0.91 region. This zone aligns with previous demand, a major Fibonacci retracement level, and the lower boundary of the broader structure, making it a crucial level for prices. If the $XRP price revisits this area, it could act as a final bottom before a shift in momentum.
While the lower range defines potential support, the first sign of structural strength sits much higher. The market technician noted that moving above $1.65 is the first macro signal that a bullish reversal is on course.
Reclaiming this level on a higher timeframe would suggest that $XRP has broken the descending structure, indicating that the prolonged corrective phase may be ending. In many cases, this type of shift marks the transition from consolidation into a new upward phase.
If that transition unfolds, the broader structure begins to open toward higher targets, guided by long-term cycle dynamics. EGRAG’s chart shows a possible breach of the major resistance at $3.53 before a sustained move towards the 1.618 Fibonacci level at $0.64.