
Bitcoin Price Rally Fades, Market Braces for Possible Downside

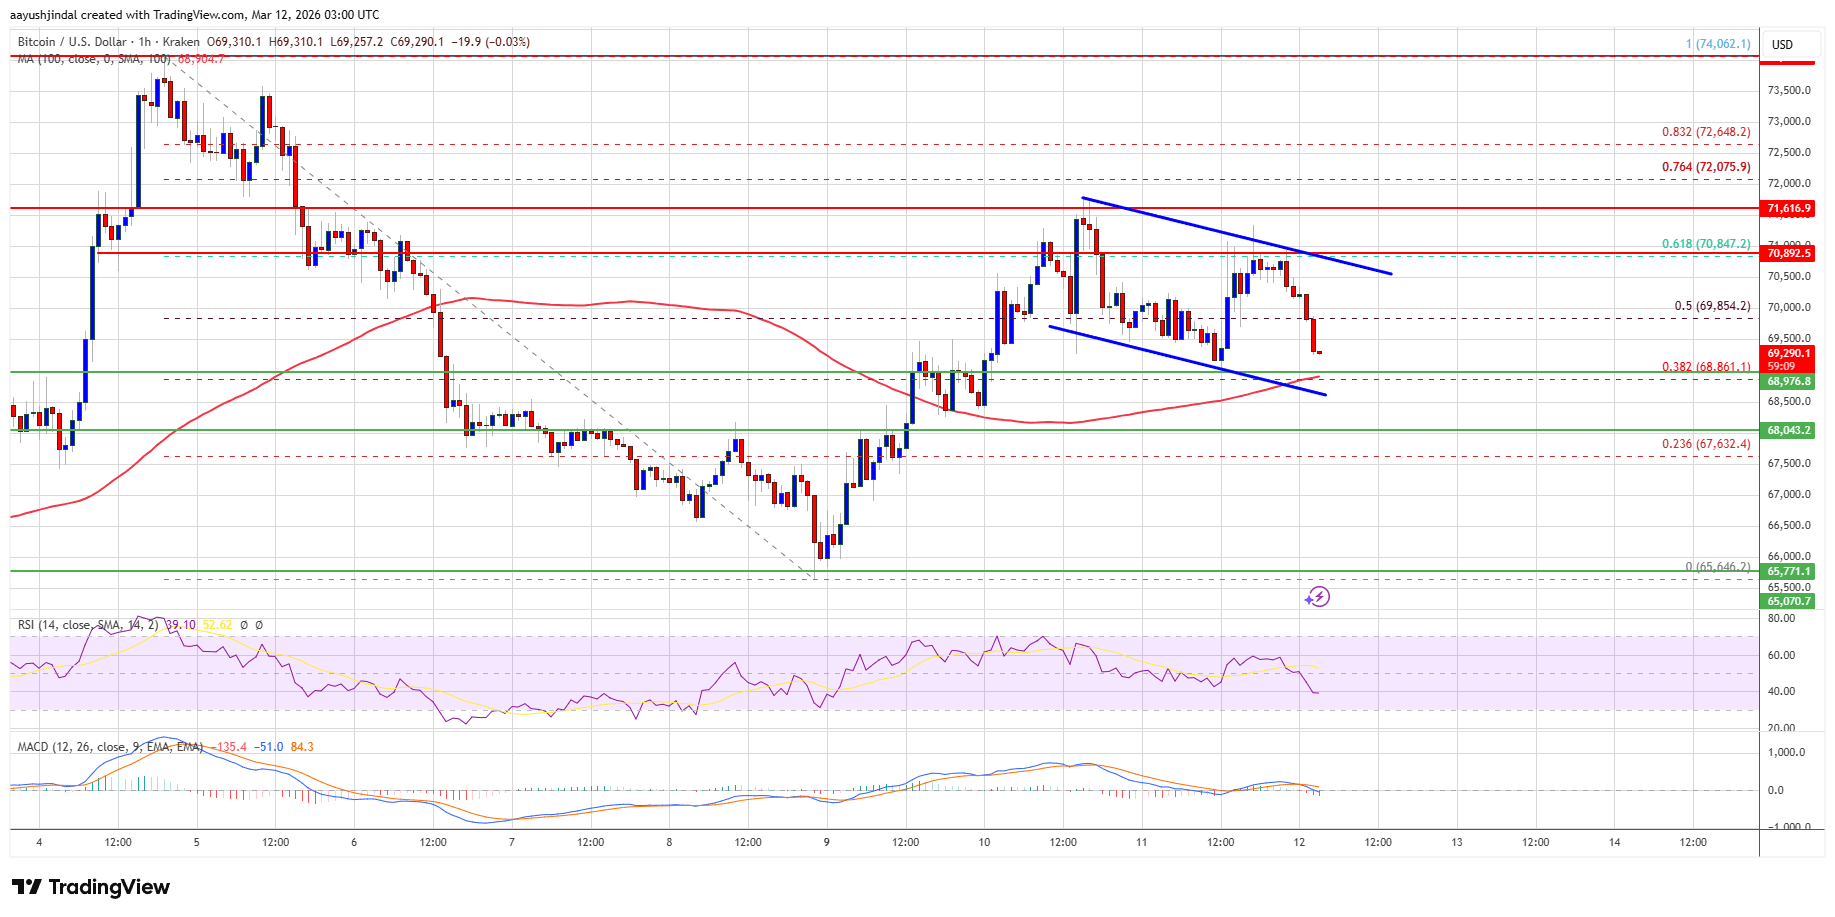
Bitcoin price failed to extend its recovery wave above the $70,500 zone. BTC is now consolidating and might decline again below $68,500.
- Bitcoin started a decent recovery wave above the $68,500 zone.
- The price is trading above $68,650 and the 100 hourly simple moving average.
- There is a key declining channel or a possible bullish flag forming with support at $68,400 on the hourly chart of the BTC/USD pair (data feed from Kraken).
- The pair might dip again if it trades below the $68,400 and $68,000 levels.
Bitcoin Price Faces Key Resistance
Bitcoin price remained elevated and extended its increase above the $68,800 level. BTC climbed above the $69,500 and $70,000 resistance levels.
The bulls pushed the price above the 61.8% Fib retracement level of the downward move from the $74,062 swing high to the $65,645 low. However, the bears are still active near $71,200. The price failed to extend gains and started a bearish wave below $70,000.
Bitcoin is now trading above $68,800 and the 100 hourly simple moving average. There is also a key declining channel or a possible bullish flag forming with support at $68,400 on the hourly chart of the BTC/USD pair.
 Source:
BTCUSD on TradingView.com
Source:
BTCUSD on TradingView.com
If the price remains stable above $68,400, it could attempt a fresh increase. Immediate resistance is near the $70,000 level. The first key resistance is near the $70,500 level. A close above the $70,500 resistance might send the price further higher. In the stated case, the price could rise and test the $71,200 resistance. Any more gains might send the price toward the $72,000 level or the 76.4% Fib retracement level of the downward move from the $74,062 swing high to the $65,646 low. The next barrier for the bulls could be $72,650.
More Downside In BTC?
If Bitcoin fails to rise above the $70,500 resistance zone, it could start another decline. Immediate support is near the $68,800 level. The first major support is near the $68,400 level.
The next support is now near the $68,000 zone. Any more losses might send the price toward the $67,250 support in the near term. The main support now sits at $66,500, below which BTC might struggle to recover in the near term.
Technical indicators:
Hourly MACD – The MACD is now gaining pace in the bearish zone.
Hourly RSI (Relative Strength Index) – The RSI for BTC/USD is now below the 50 level.
Major Support Levels – $68,400, followed by $68,000.
Major Resistance Levels – $70,500 and $71,200.
Disclaimer: The content of this article solely reflects the author's opinion and does not represent the platform in any capacity. This article is not intended to serve as a reference for making investment decisions.
You may also like
PCB Technologies to Acquire 100% of Gorilla Circuits at Enterprise Value of $120M >PCBT.TV
PCB Technologies to Acquire 100% of Gorilla Circuits at Enterprise Value of $120M >PCBT.TV
LEVI STRAUSS & CO <LEVI.N>: JP MORGAN CUTS TARGET PRICE TO $33 FROM $34
LEVI STRAUSS & CO : JP MORGAN CUTS TARGET PRICE TO $33 FROM $34
LAZARD, INC. <LAZ.N>: KBW CUTS TARGET PRICE TO $39.00 FROM $42.00
LAZARD, INC. : KBW CUTS TARGET PRICE TO $39.00 FROM $42.00
What Stocks Will Shine When the AI Bubble Bursts? John Rogers Says Look to Smucker's
Crypto prices
More


