
Ether price again rejected at $2K: How low can ETH go in March?

Ether’s (ETH) rally stalled late Monday just above $2,000 due to stiff overhead resistance, as the technical setup suggested that downward momentum would increase if the ETH/USD pair breaks below $1,800.
Key takeaways:
ETH price must hold above $1,800 to avoid another leg down.
Ether’s bearish charts and onchain indicators converge on ETH prices below $1,500.
ETH price: $1,800 remains a key level to watch
Ether’s cost-basis distribution heatmap shows strong support recently established around $1,800. This is where about 1.23 million ETH were acquired at an average price of $1,890 over the last 30 days.
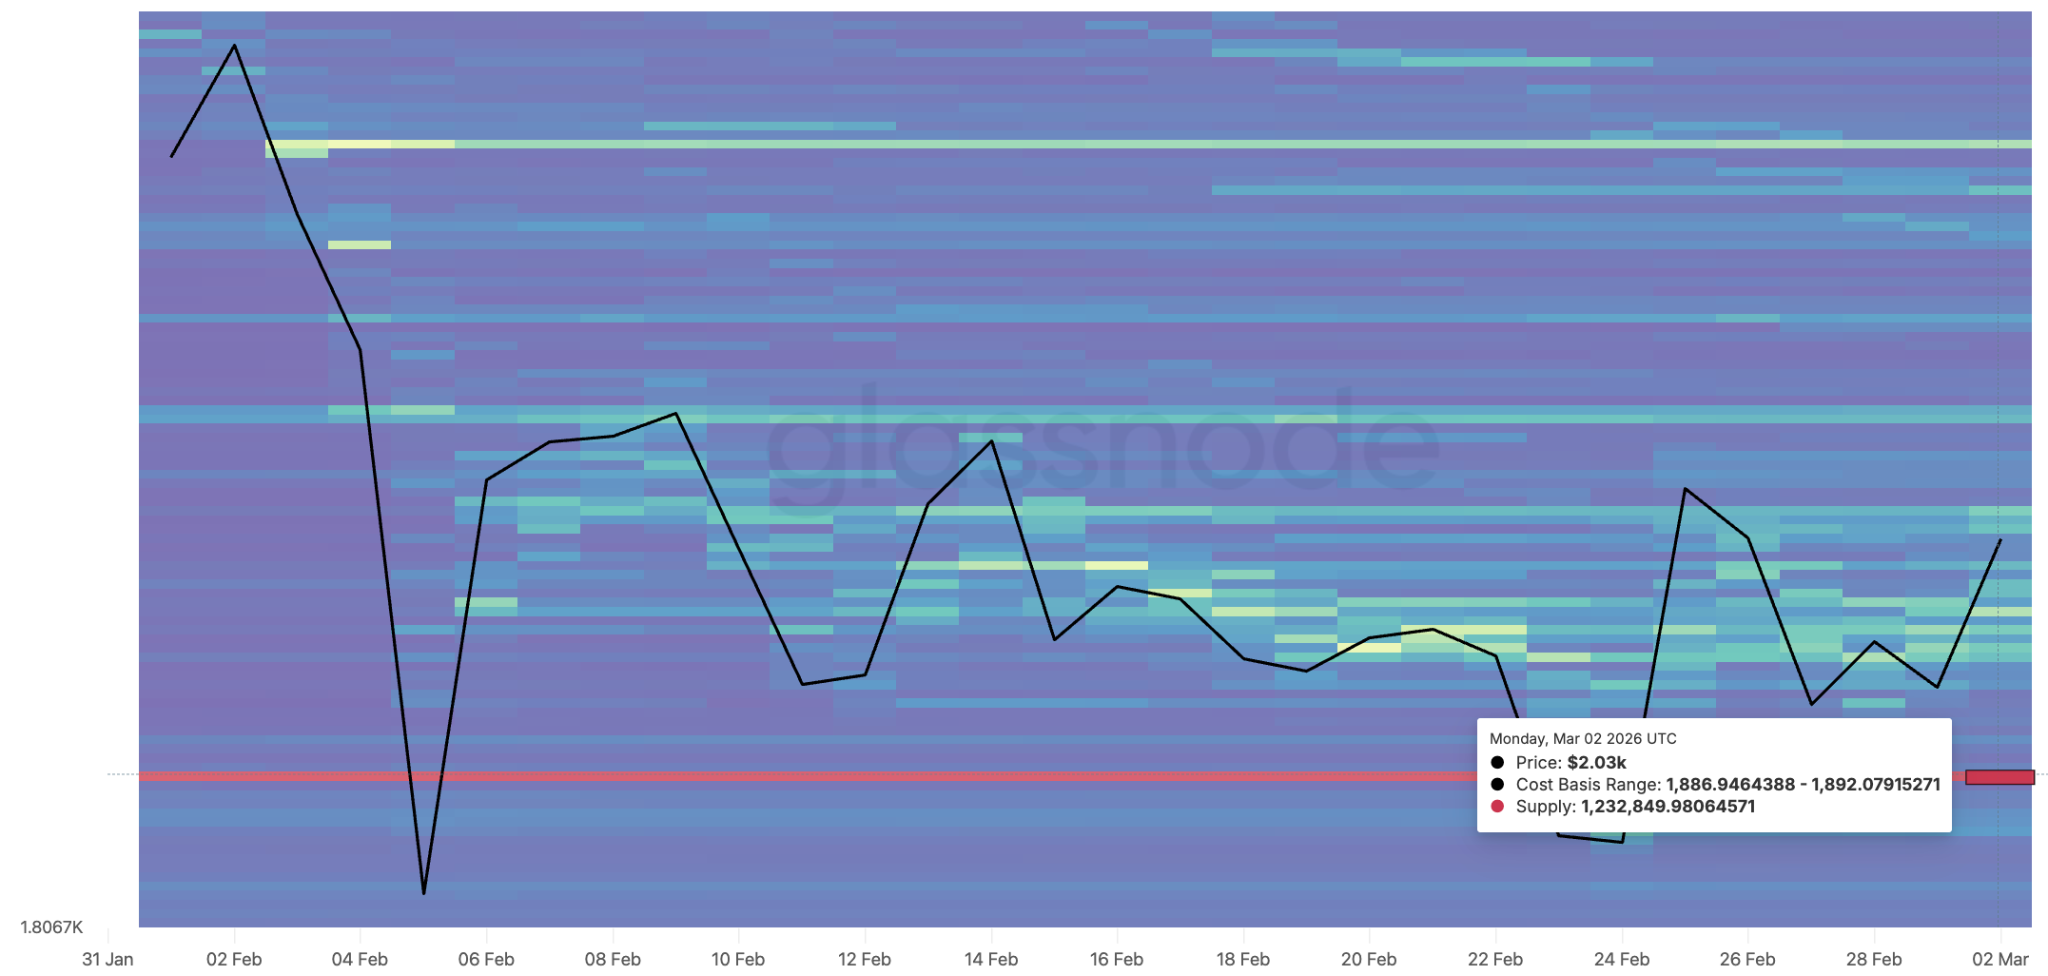
This area is now a strong support for ETH, which, if broken, would likely see the price retest February’s lows.
Related: Ether is 60% down from its 2025 high, but TradFi keeps betting on ETH: Here’s why
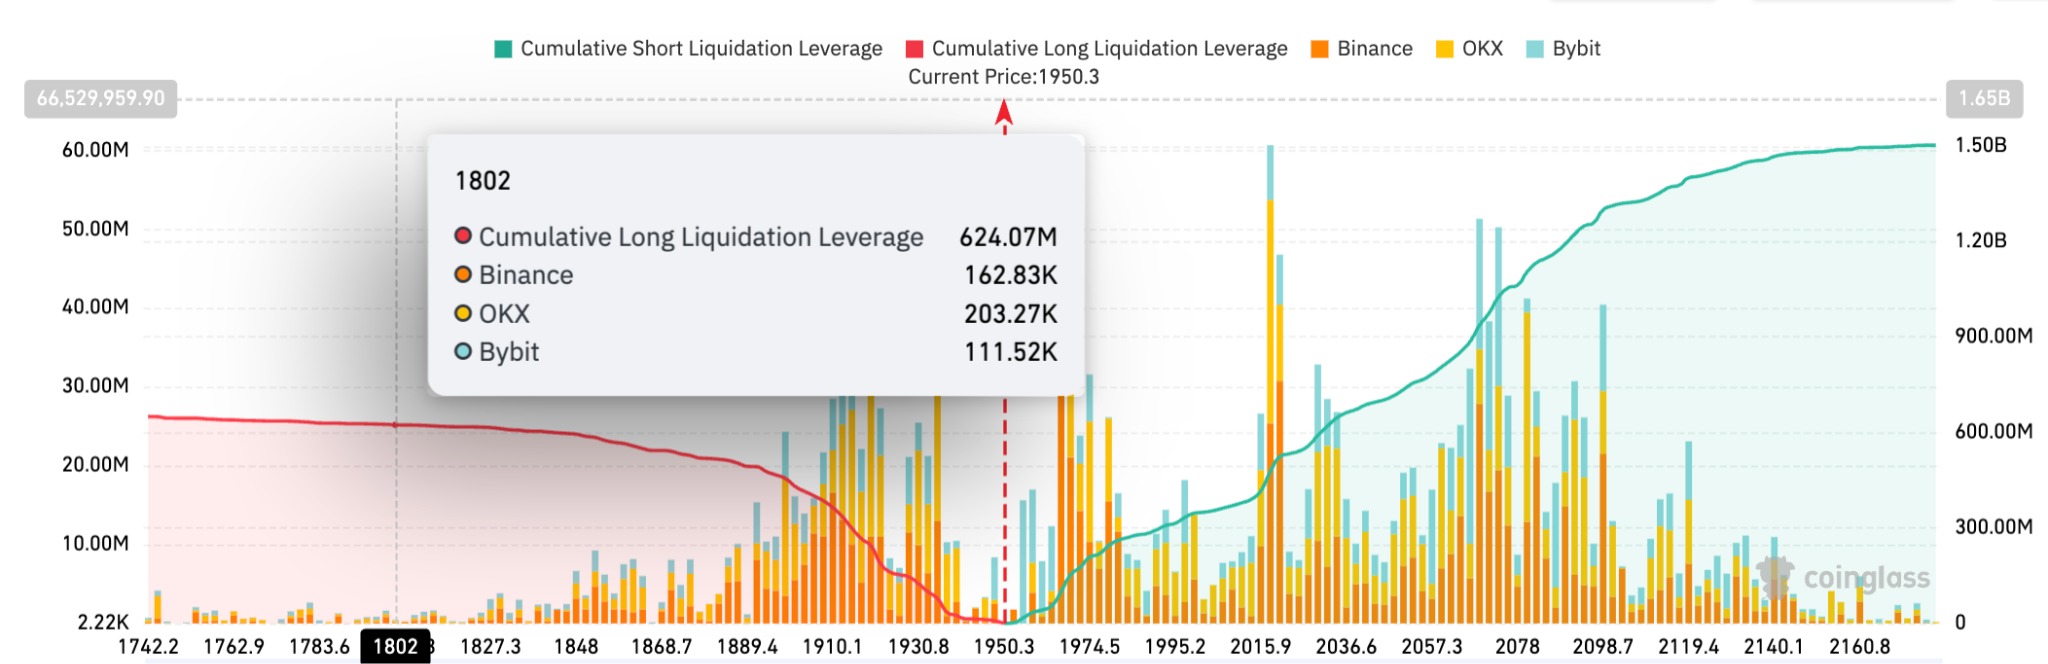
CoinGlass data shows short liquidations of over $120 million over the past two days, clearing overhead leverage. Now, $624 million in cumulative long liquidation exposure sits above $1,800, forming a liquidity pocket below the spot price.
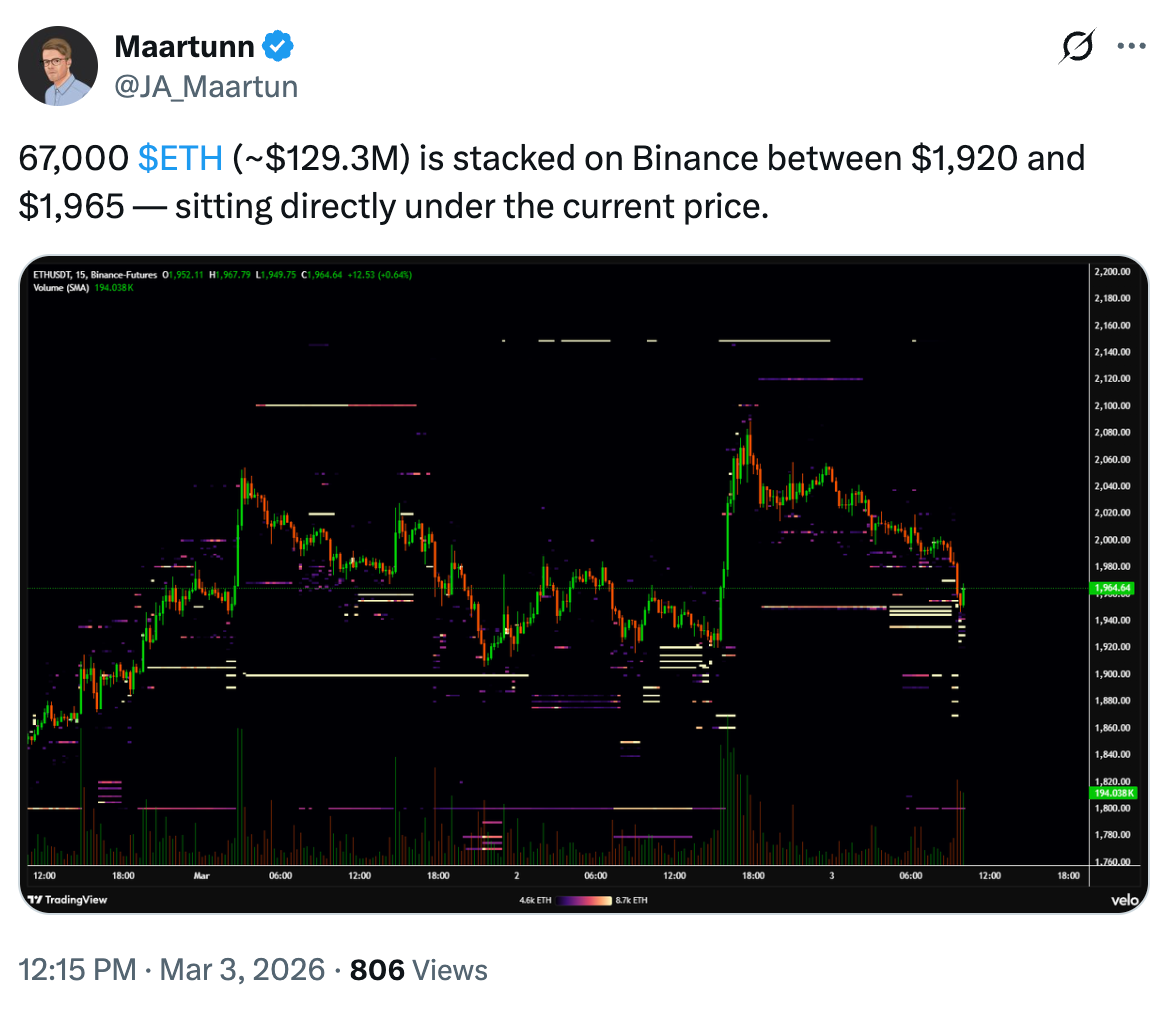
CryptoQuant analyst Maartunn spotted 67,000 ETH, worth about $130 million, sitting just below the spot price, reinforcing the significance of this support zone.
ETH price triangle pattern targets sub-$1,500
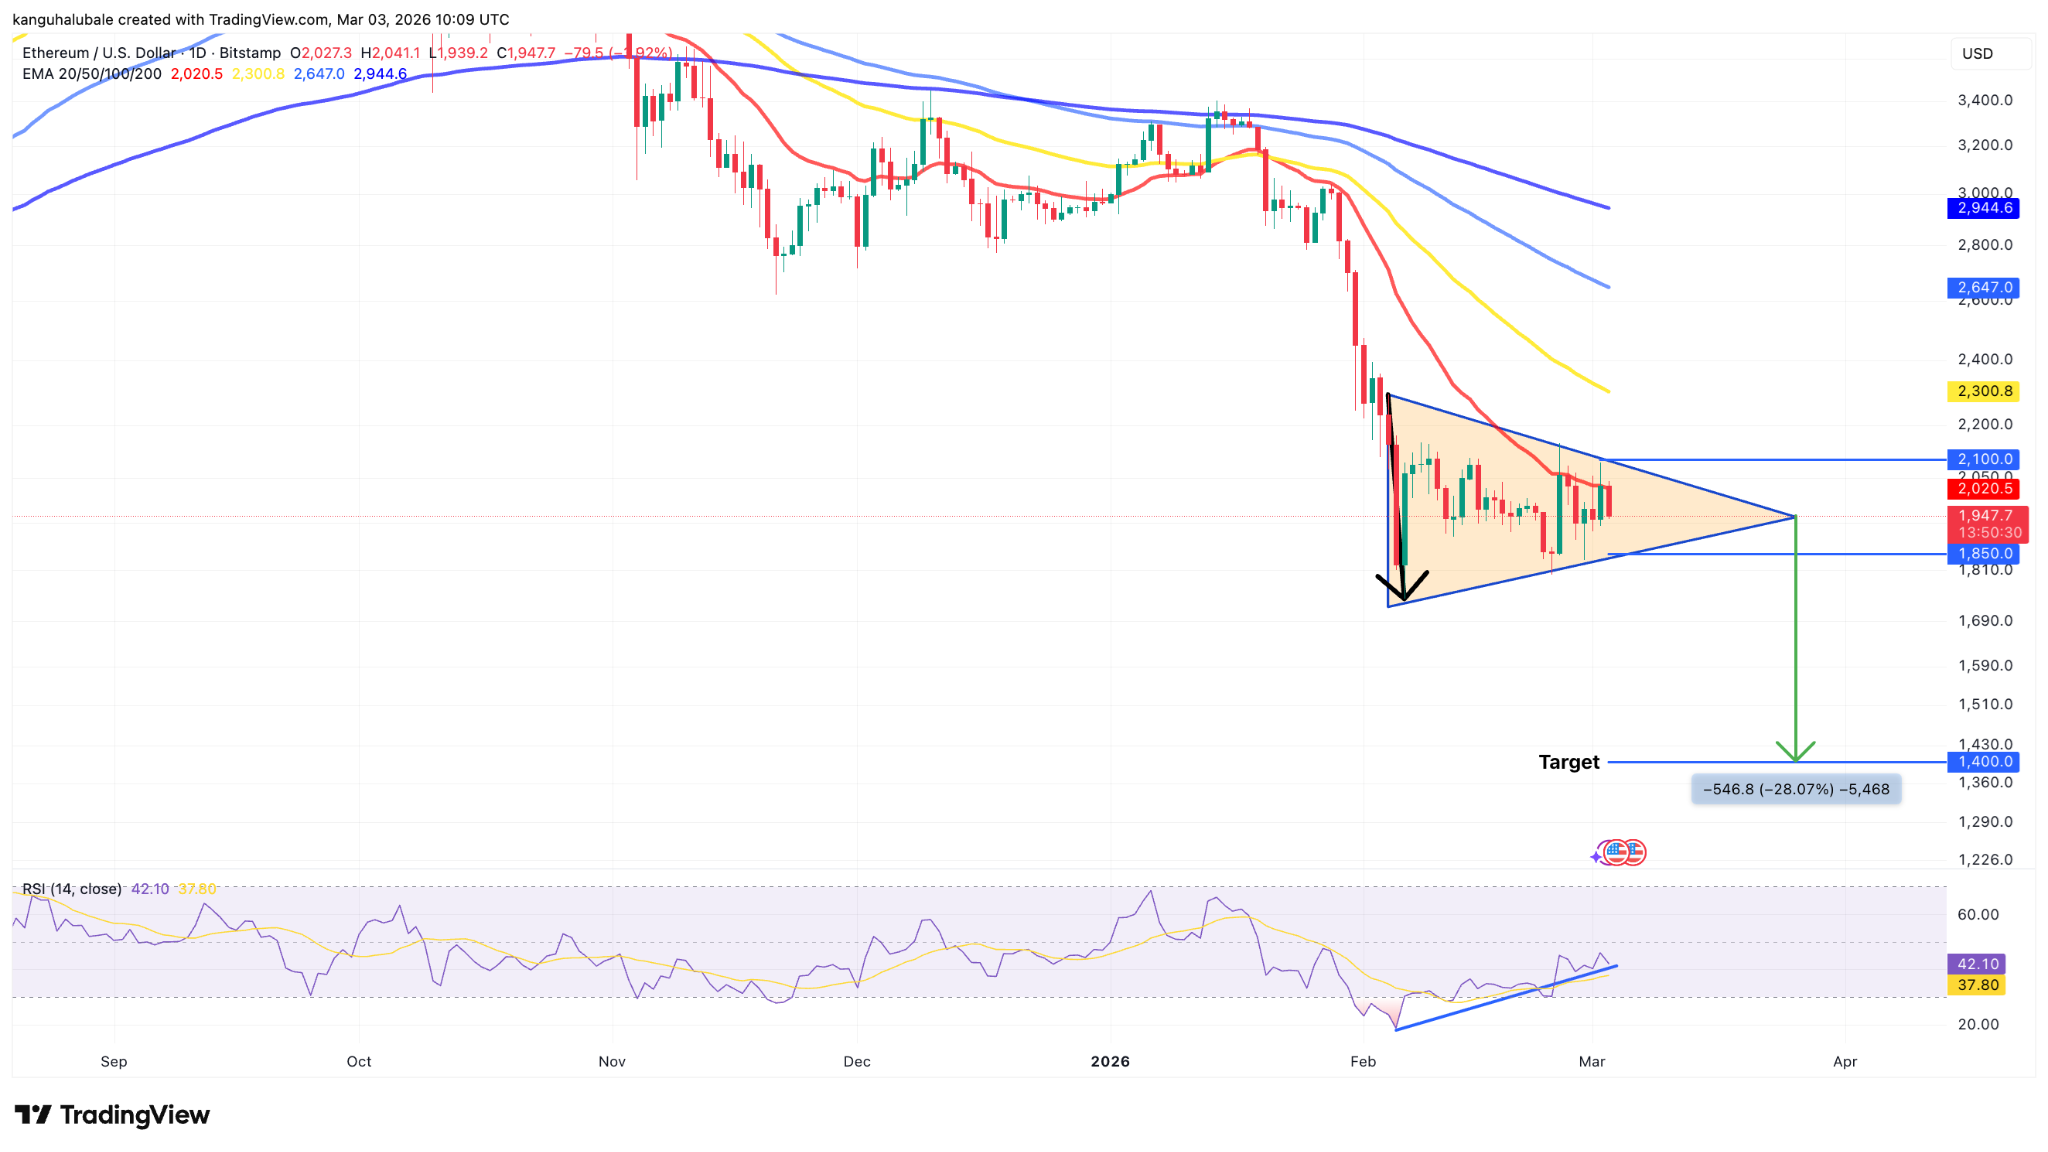
From a technical point of view, the $1,800-$1,900 support zone coincides with the lower trend line of a symmetrical triangle on the daily chart.
If the bearish momentum persists, the ETH/USD pair might drop below the lower boundary of the triangle at $1,850 to test support at $1,750, the multi-year low reached on Feb. 6.
Below that, ETH could drop toward the measured target of the triangle at $1,400, 28% below the current price.
Meanwhile, Ether’s MVRV extreme deviation pricing bands suggest that ETH price still has room to drop before the unrealized profit held by investors reaches an extreme level, or around $1,650, as shown in the chart below.
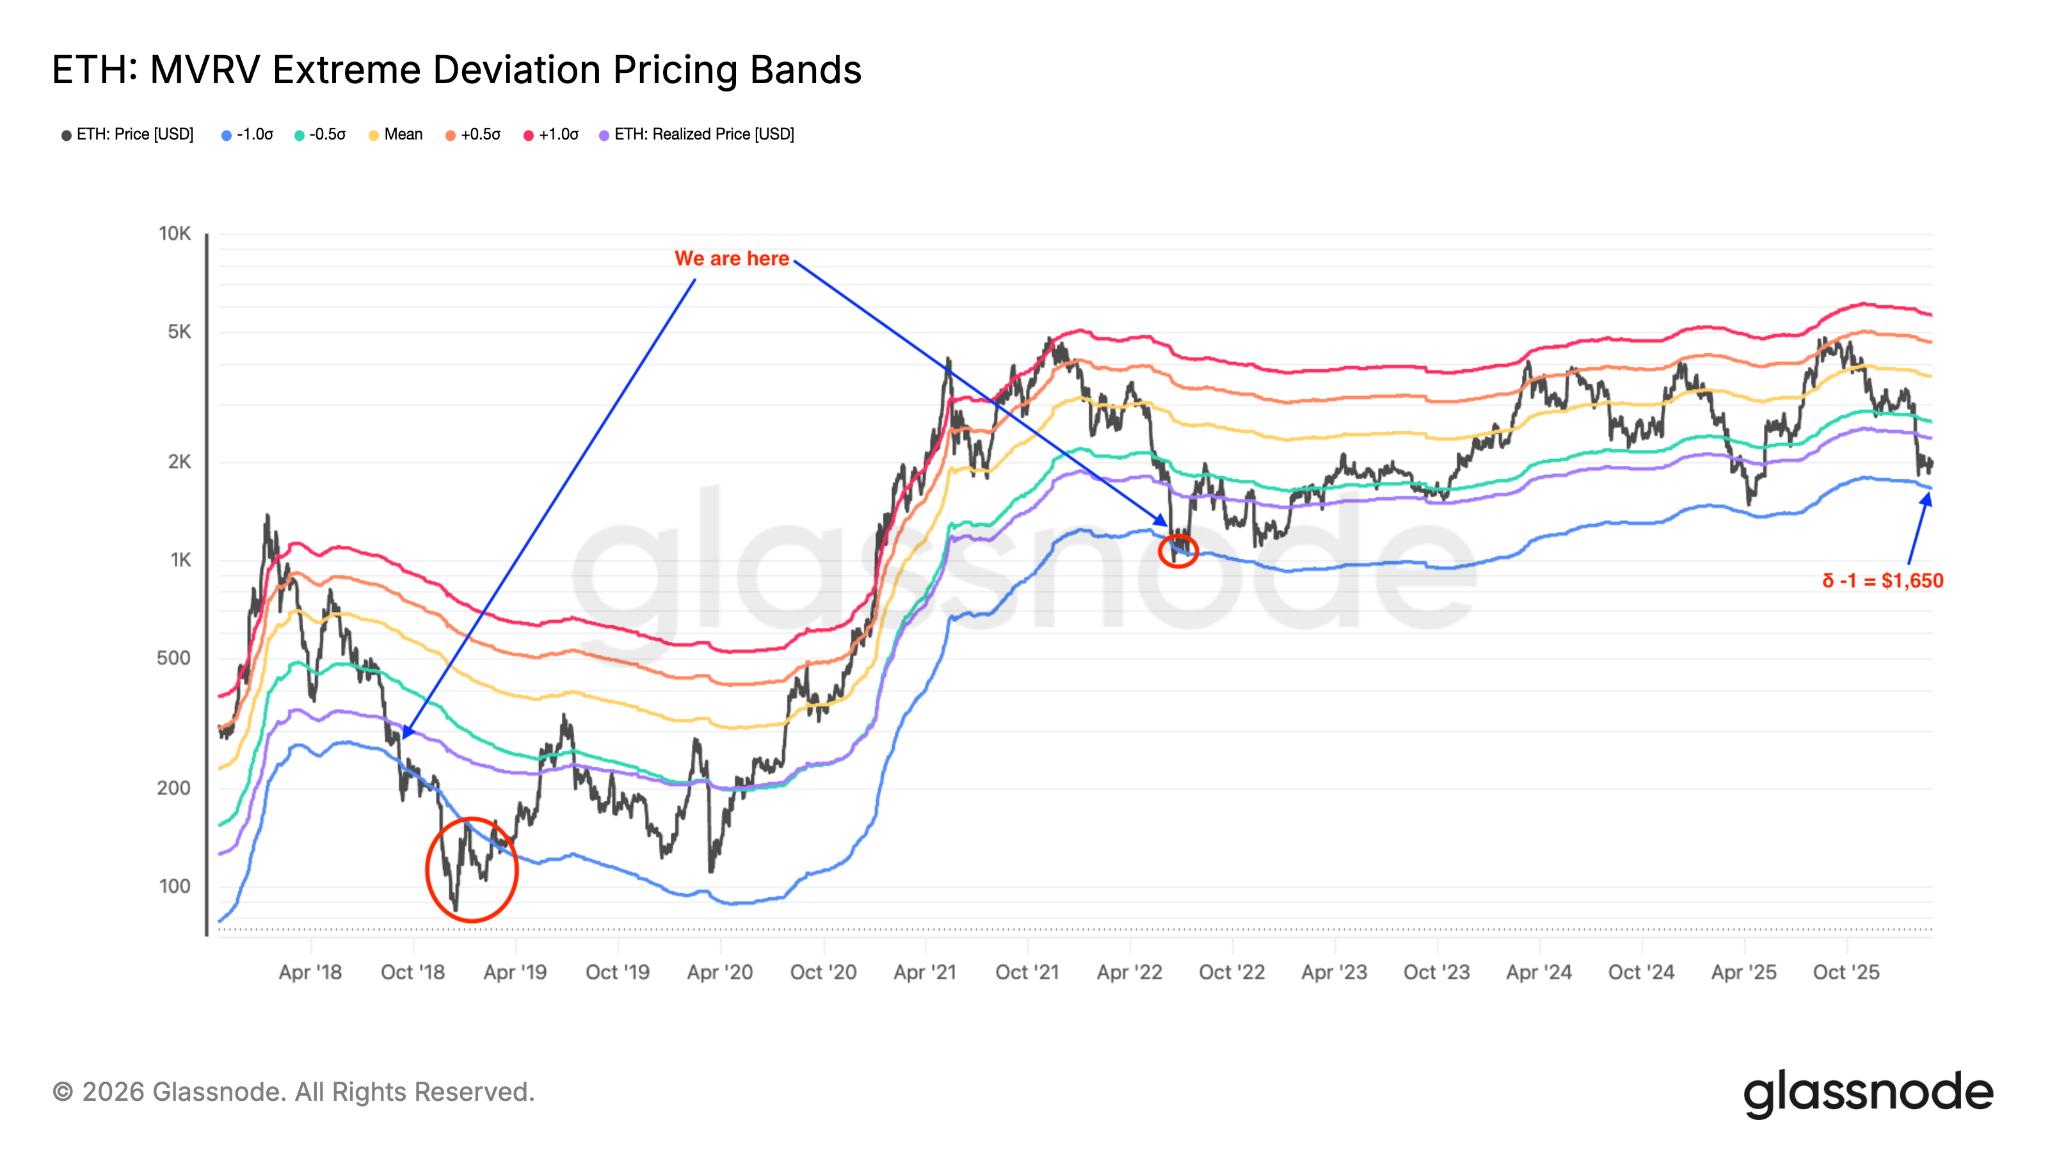
During past bear markets, ETH has always bottomed below the lowest MVRV band, as seen in 2018 and 2022.
If this happens again, the ETH price bottom may be below $1,650 during the current cycle, aligning with the aforementioned symmetrical triangle target.
Disclaimer: The content of this article solely reflects the author's opinion and does not represent the platform in any capacity. This article is not intended to serve as a reference for making investment decisions.
You may also like
Iranian official vows to "never give up" uranium enrichment rights, denies US-Iran "negotiations", and threatens to block the "illegal route" of the Strait of Hormuz
According to reports, senior Iranian officials stated on Wednesday that before discussing nuclear issues, the US must first meet the conditions set by Iran, as the US's current proposals for the nuclear program contradict Iran's demands. Vance's recent proposal only represents the US's stance. On Monday, Vance said Iran must make "substantial" reductions in its uranium enrichment capacity to meet US requirements. On Wednesday, Brent crude oil briefly surged above $102 per barrel.
FOMC Minutes Today: Will a Hawkish Fed Push the Dollar Higher Against EUR, GBP, and JPY?
Cardano Launches Programmable Tokens as TOKEN2049 Expands to the US
Constellation Brands stock gains 2.08%, but stays below all three daily EMAs
Crypto prices
More


