

-
KAIA price shows strengthening momentum as derivatives volume, open interest, and spot demand rise together
-
Futures positioning suggests growing bullish conviction rather than short-term speculation
-
A technical breakout places focus on whether KAIA can flip its long-term resistance zone
The KAIA price recorded a 39% intraday jump, making it the top asset of the day on the top 100 assets list. It has moved particularly into focus after a sharp 6-7 times rise in derivatives activity, spot volume, and on-chain engagement was witnessed. As capital flows accelerate and network usage improves, this clearly reflects demand. As a result, market participants are keeping KAIA on the watchlist.

KAIA Price Strengthens as Derivatives Activity Surges
Momentum around KAIA price has intensified as futures markets light up. Data from CoinGlass shows derivatives volume surged over 1,000% to approximately $545 million, while open interest climbed nearly 269% to $40 million. Notably, the long/short ratio rose above parity to 1.019, signaling bullish dominance among top traders, particularly on Binance.
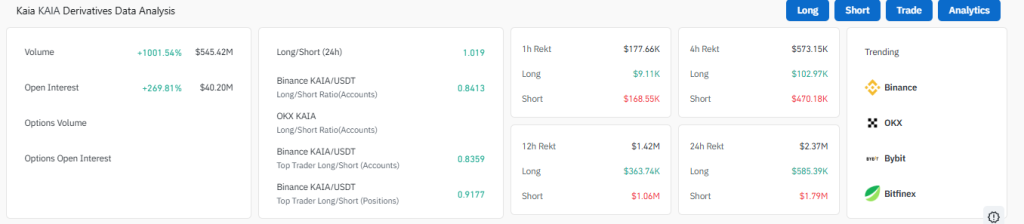
When rising open interest accompanies increasing volume, it typically reflects fresh capital entering the market rather than traders merely rotating positions. As a result, the recent expansion points toward heightened conviction rather than short-lived volatility, reinforcing the short-term KAIA price forecast.
In addition to futures activity, spot market metrics have mirrored the bullish tone. At press time, 24-hour spot volume reached roughly $145 million, while the liquidity ratio rose to 27.1%, indicating deeper order books and improved trade efficiency.
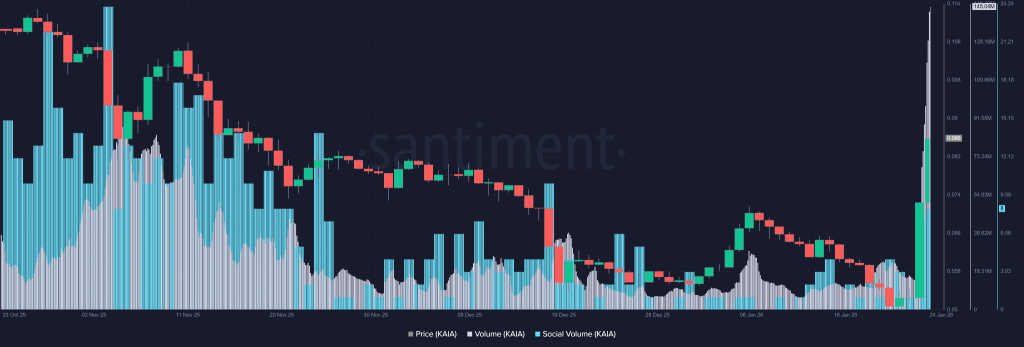
Such conditions often support price stability during rallies, as higher liquidity reduces slippage and attracts larger participants.
Therefore, the alignment between derivatives and spot data suggests growing demand rather than speculative imbalance, strengthening the overall KAIA crypto outlook.
Social and Development Activity Add Fundamental Support
On-chain and santiment indicators have also improved. Social volume surged notably this week as discussions around KAIA increased across X, highlighting rising retail attention.
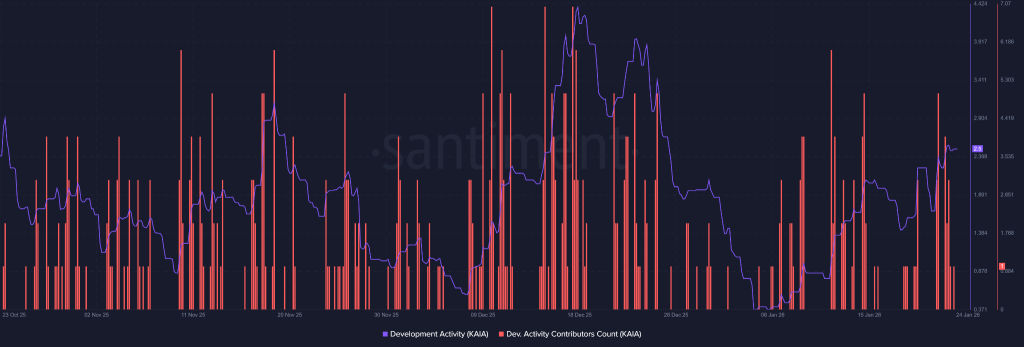
Meanwhile, development activity and development count have trended higher, signaling active progress behind the scenes.
Historically, periods where social engagement rises alongside development growth have coincided with expanding ecosystems rather than temporary hype. Consequently, this backdrop provides additional support to the current KAIA price USD structure.
Gaming Integration Acts as a Near-Term Catalyst
Beyond market data, real-world developments have contributed to the upside. KAIA received a boost after Metabora Games partnered with Noestallagames to launch the Web3 title Magic Squad. Crucially, the game introduced gas abstraction via the KAIA wallet, allowing users to transact without holding KAIA tokens.
This lowers entry barriers for mainstream users and enhances usability, potentially increasing transaction throughput and on-chain engagement. As adoption-focused integrations tend to drive organic usage, this development adds weight to the medium-term KAIA price prediction narrative.
KAIA Price Chart Signals a Technical Turning Point
From a technical standpoint, the KAIA price chart shows a decisive breakout from a multi-month descending channel. Price has reclaimed both the 20-day and 50-day EMAs and is now approaching the 200-day EMA band near a key resistance zone.
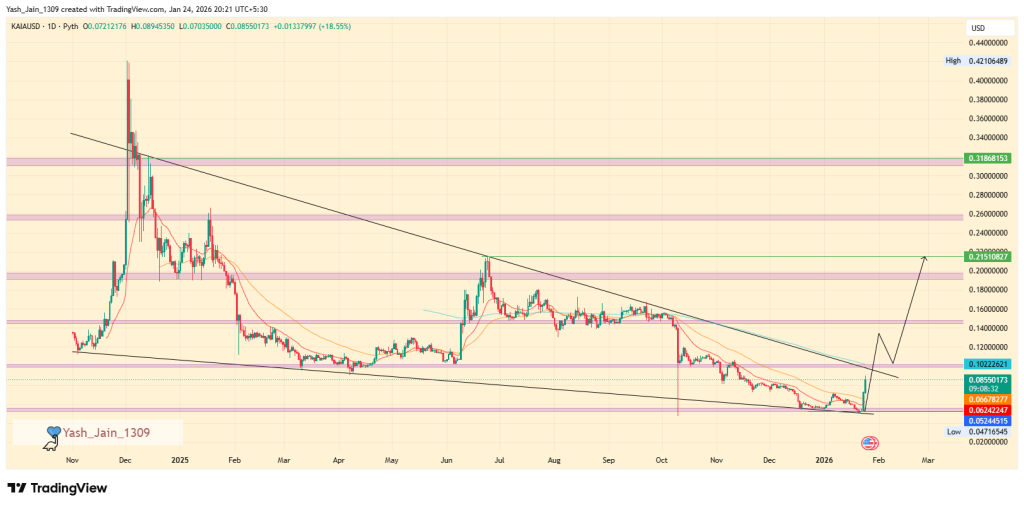
At around $0.085 with a market cap close to $534 million, a successful flip of the 200-day EMA aligned with the channel’s upper boundary and it could open a path toward the $0.21 area, implying a potential 150% extension. Conversely, rejection at this level may result in further consolidation as the market absorbs recent gains, keeping the KAIA price structure constructive but range-bound.



