

Bitcoin price today trades near $95,676 after failing to reclaim the 100-day EMA for the third consecutive session. The move comes as institutional and retail flows diverge, creating a tug-of-war between ETF accumulation and spot distribution.
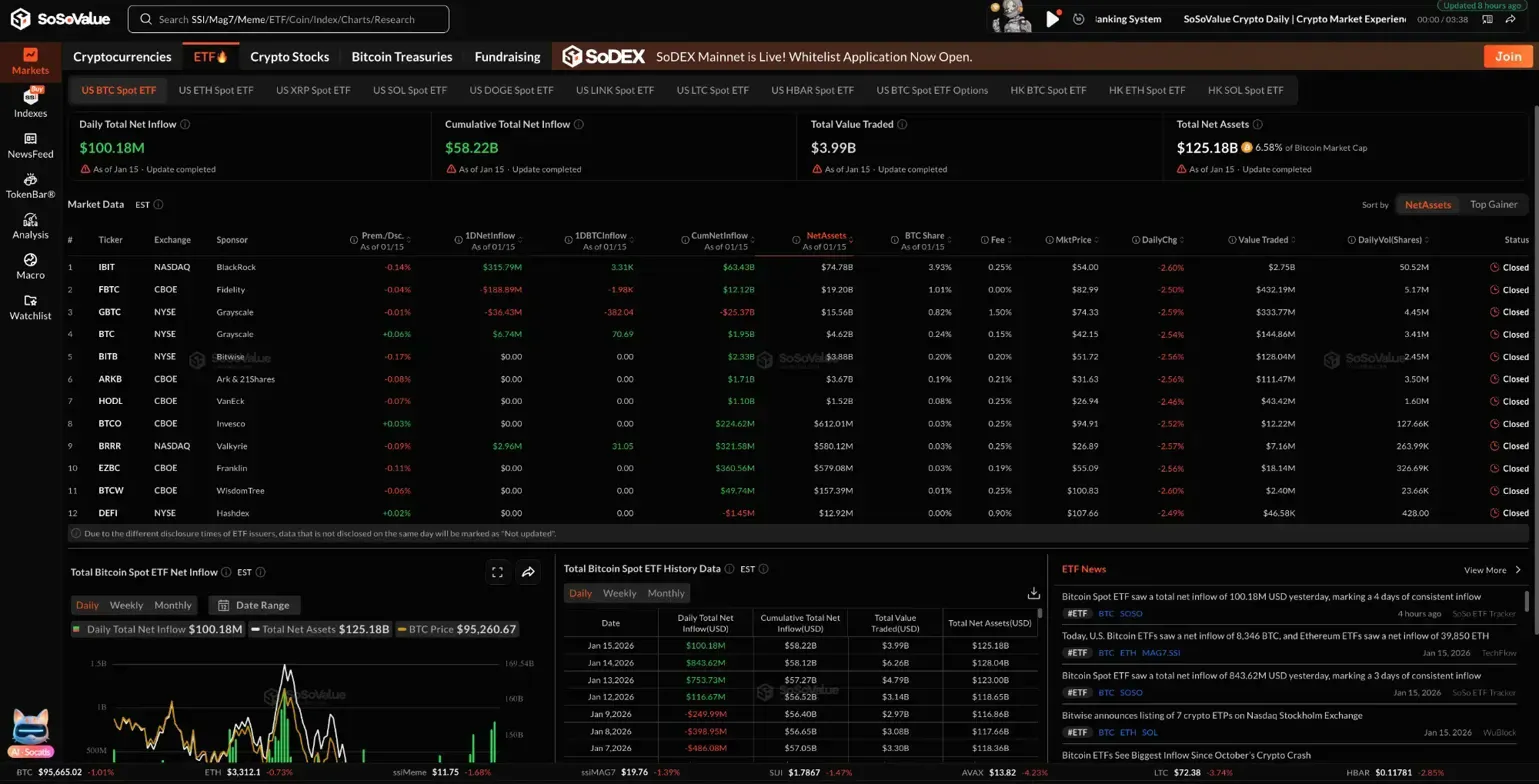
Institutional demand remains intact despite the choppy price action. According to SoSoValue, Bitcoin spot ETFs recorded $100.18 million in net inflows on January 15, extending the streak to four consecutive days of accumulation.
BlackRock’s IBIT led the session with $315.79 million in fresh capital. Fidelity’s FBTC followed with $188.89 million. Grayscale’s GBTC continued its bleed, shedding another $36.43 million as legacy holders rotate into lower-fee products.
Total ETF assets under management now sit at $125.19 billion. The cumulative net inflow since launch has reached $58.22 billion, reflecting sustained institutional conviction even as price consolidates below key resistance.
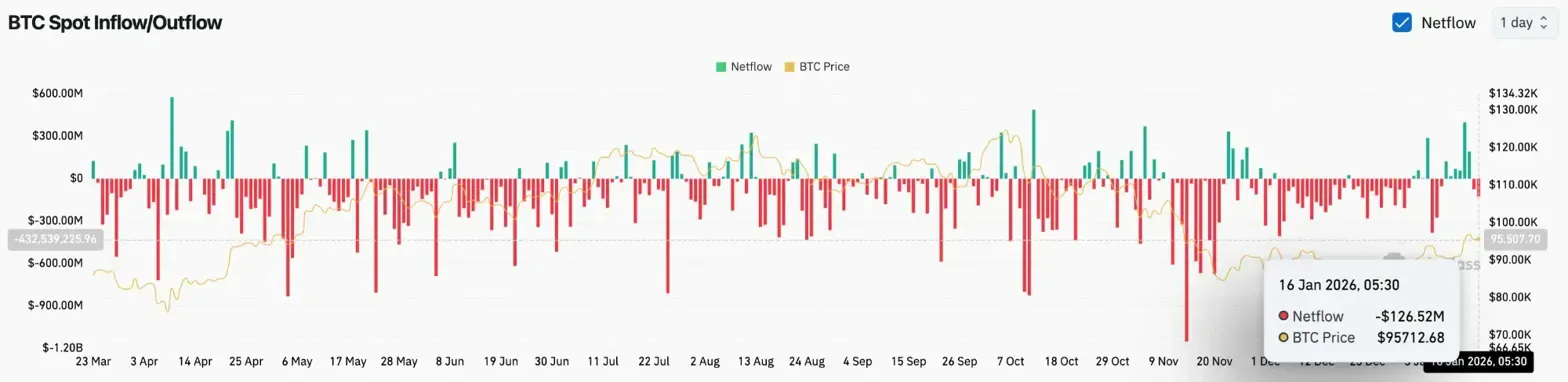
The spot market tells a different story. Coinglass data shows $126.52 million in net outflows from exchanges on January 16. Coins are moving back onto exchanges rather than into cold storage, a pattern typically associated with selling pressure.
Related: Shiba Inu Price Prediction: Burn Rate Collapses 87% As Only 550K SHIB…
This divergence matters. ETF buyers accumulate through regulated vehicles while spot holders distribute into that bid. The result is a market that absorbs selling without breaking down but lacks the momentum to push higher.
When flows conflict, price tends to range. That dynamic explains the tight consolidation between $94,000 and $98,000 over the past week.
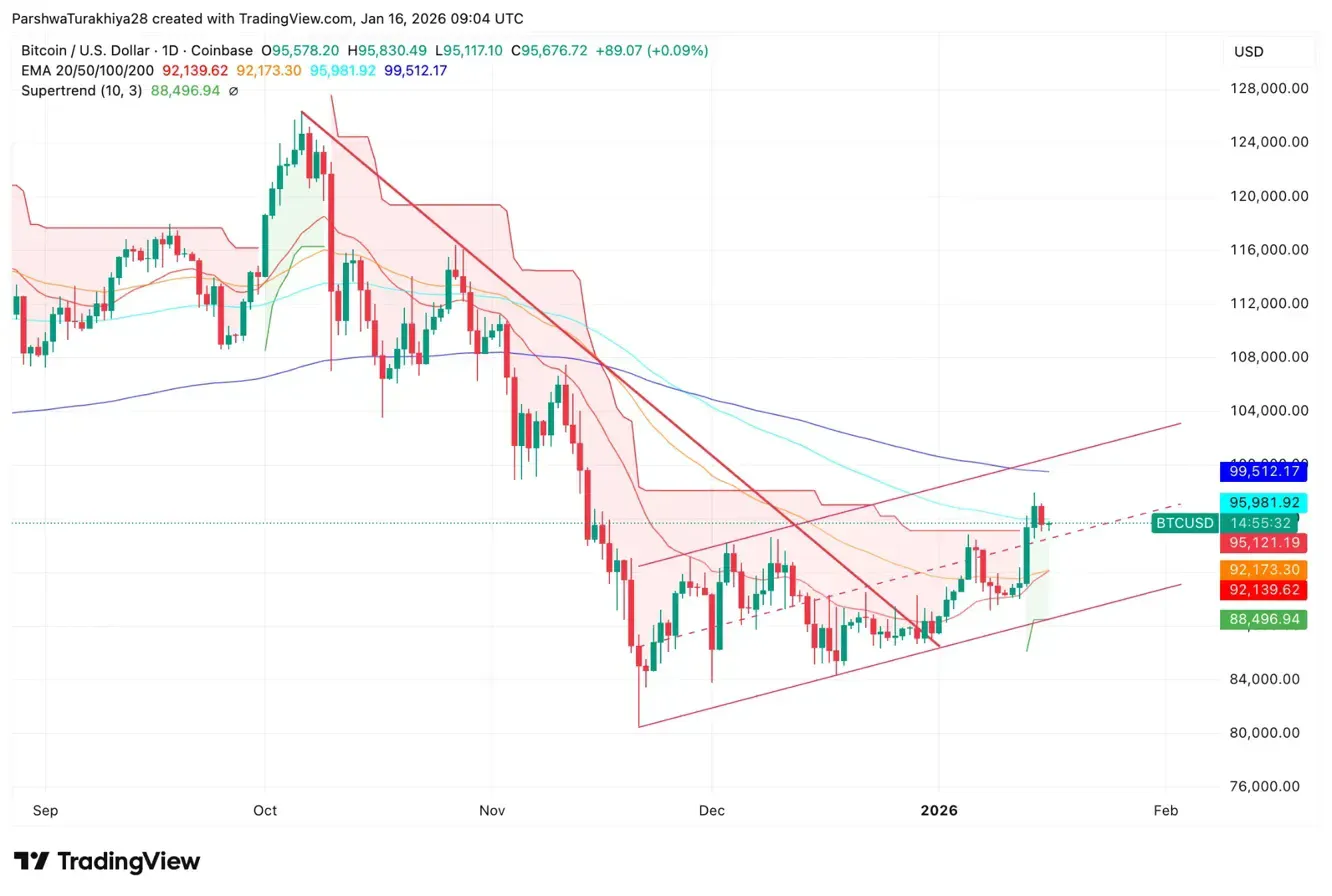
On the daily chart, Bitcoin remains trapped between the 50-day EMA at $92,173 and the 100-day EMA at $95,981. The 200-day EMA sits overhead at $99,512, marking the major resistance that bulls need to reclaim.
The recent structure shows a series of higher lows forming off the December bottom near $80,000. Price has recovered inside a rising channel but continues to face rejection at the upper boundary near $98,000.
Key levels now stand at:
- Immediate resistance: $95,981 (100 EMA)
- Major resistance: $99,512 (200 EMA)
- Near-term support: $92,139 to $92,173 (20/50 EMA cluster)
- Breakdown level: $88,496 (Supertrend)
The Supertrend indicator remains bullish on the daily timeframe, suggesting the broader recovery trend stays intact as long as price holds above $88,500.
Related: Dogecoin Price Prediction: DOGE Rebounds After Sharp Dip, but Resistance…
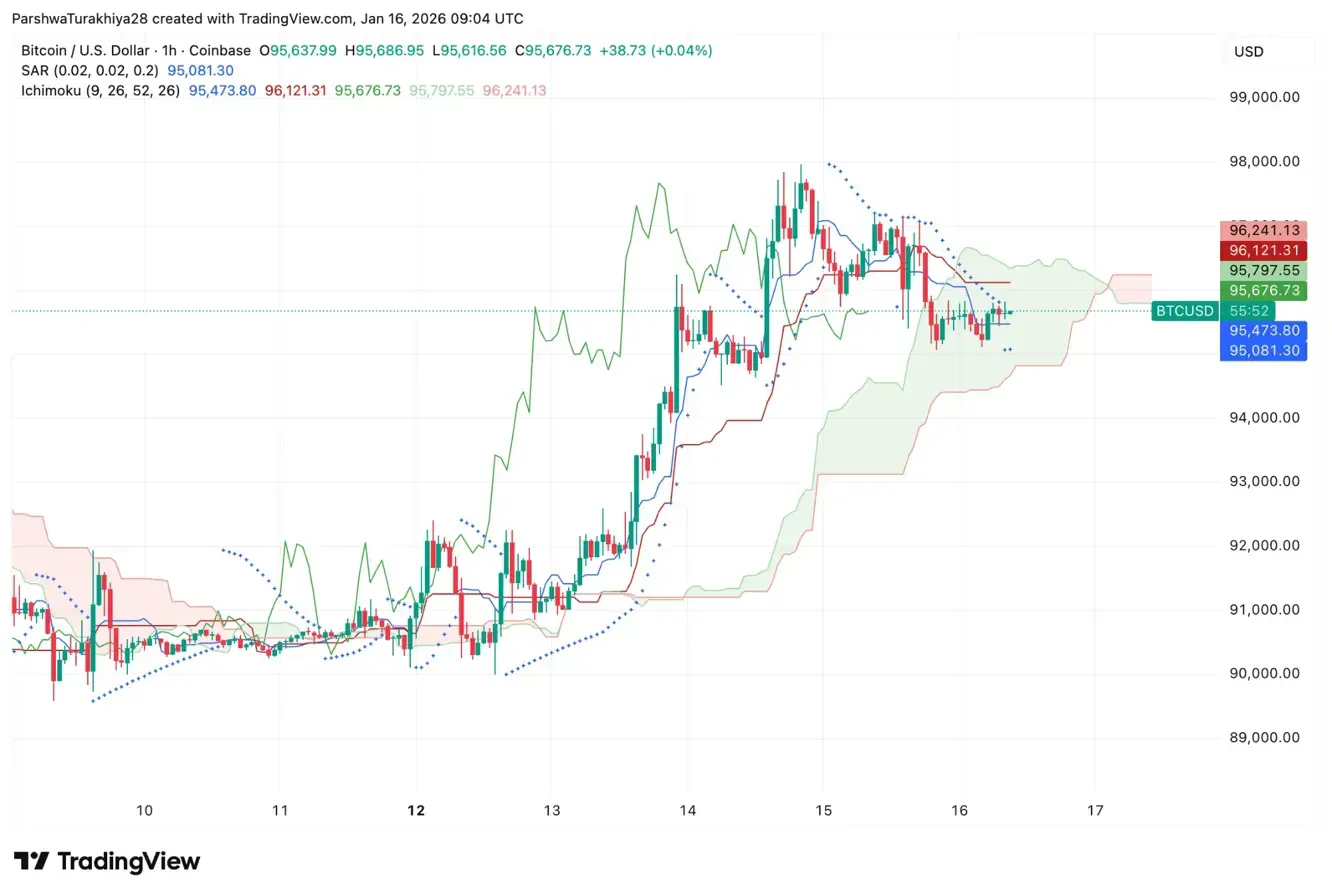
Shorter timeframes reveal a market searching for direction. On the hourly chart, Bitcoin trades inside the Ichimoku cloud, reflecting indecision between buyers and sellers.
The Parabolic SAR sits at $95,081, just below current price. A close beneath this level would flip short-term momentum bearish and open the door to a retest of $94,000.
Buyers have defended the $95,000 zone on multiple intraday tests. That level now acts as the line in the sand for short-term positioning.
The trend remains constructive but lacks confirmation. ETF flows support the bid, yet spot distribution caps upside momentum. Until one side overwhelms the other, range conditions persist.
- Bullish case: A daily close above $95,981 clears the 100 EMA and targets $99,500. Reclaiming the 200 EMA with volume confirms trend resumption toward $104,000.
- Bearish case: Losing $92,000 breaks the EMA cluster and exposes $88,500. A close below the Supertrend flips structure bearish and opens $85,000.
Bitcoin sits at an inflection point. The next sustained move depends on whether ETF accumulation can absorb spot selling pressure and drive price through overhead resistance.
Related: Internet Computer Prediction 2026: Mission70 Cuts Inflation 70% and AI Integration Target $8-$12


