

The decline in Solana’s price is now raising fear among intraday traders, as nearly $90 million worth of long-leveraged positions are on the verge of liquidation.
On the 23rd of December, the overall crypto market declined by 1.65%, led by Bitcoin and Ethereum, which posted losses of 2.45% and 2.75%, respectively, over the past 24 hours, influencing broader market sentiment.
Amid the market decline, Solana [SOL] fell by 1.55% and is trading at the $124.30 level. During the same period, traders and investors showed strong interest, with trading volume surging more than 17% to $3.55 billion.
The rising trading volume, along with a price decline, suggests that market participants are interested in SOL’s current trend, as further recorded on the derivative tool CoinGlass.
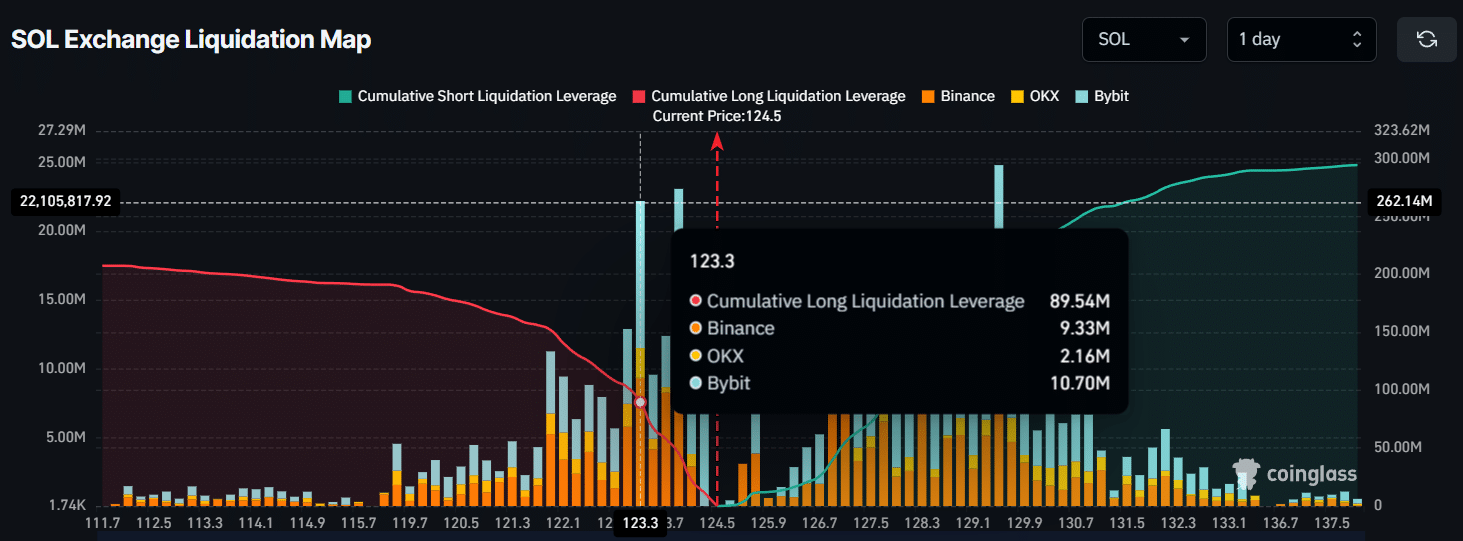
According to the SOL exchange liquidation map, intraday traders are heavily over-leveraged at $123.30 on the lower side and $129.50 on the upper side, where the highest interest has been recorded.
At these levels, traders have built $89.54 million worth of long-leveraged positions and $204.18 million worth of short-leveraged positions.
Source: CoinGlass
This indicates strong bearish sentiment among intraday traders, with a firm belief that the SOL price will not cross the $129.5 level.
Despite the short-term bearish outlook, crypto and Wall Street investors are adding SOL to their portfolios, as the price appears to be struggling.
Is Solana bullish in long term?
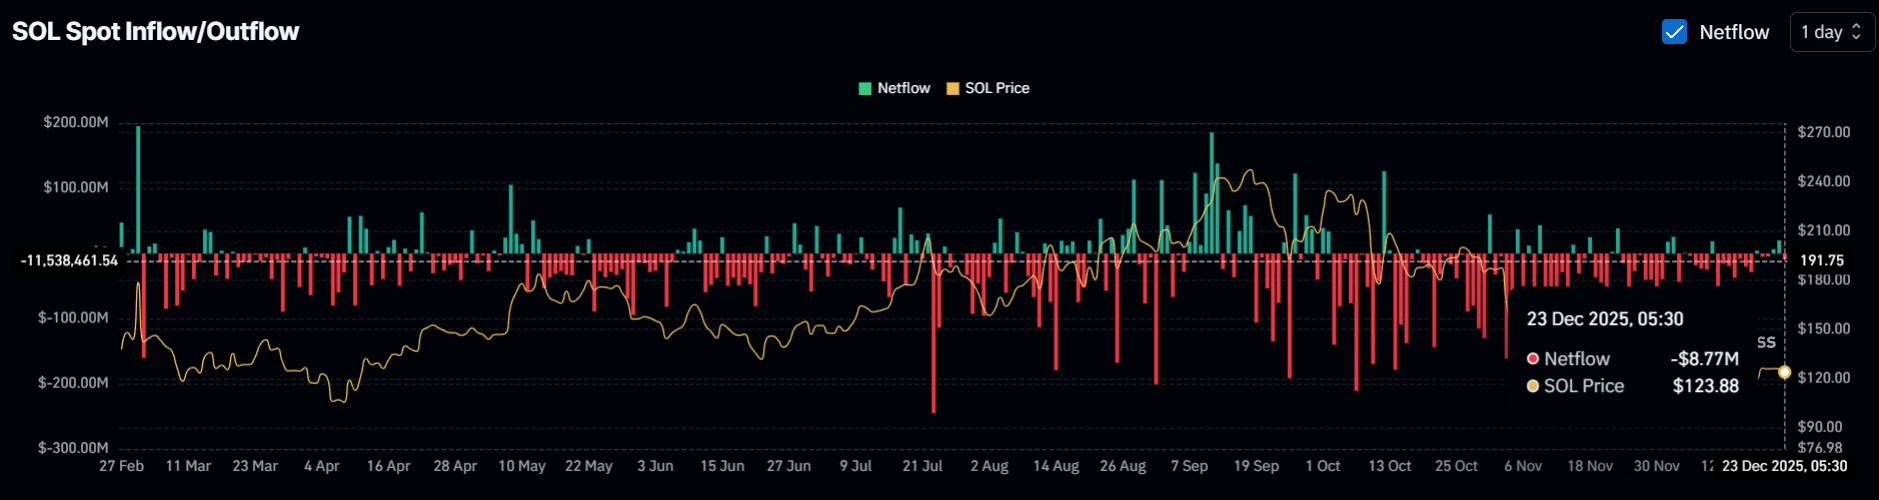
Per the Spot Inflow/Outflow, more than $8.77 million worth of SOL has flowed out of exchanges into wallets, indicating potential accumulation and suggesting that it may be protecting SOL from further decline.
Source: CoinGlass
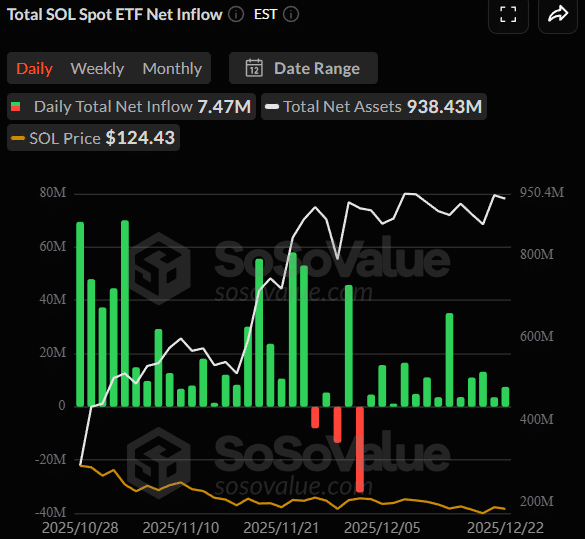
Another factor that appears to be preventing further downside in SOL is the consistent inflows into U.S. Solana spot exchange-traded funds (ETFs) since the 4th of December.
Inflows into crypto ETFs suggest that Wall Street investors are deploying fresh capital into digital investment products, reflecting growing interest in the underlying assets.
Moreover, sustained inflows into spot Solana ETFs indicate rising demand for SOL, which is a bullish signal for holders.
Source: SoSoValue
Solana: price action and key levels to watch
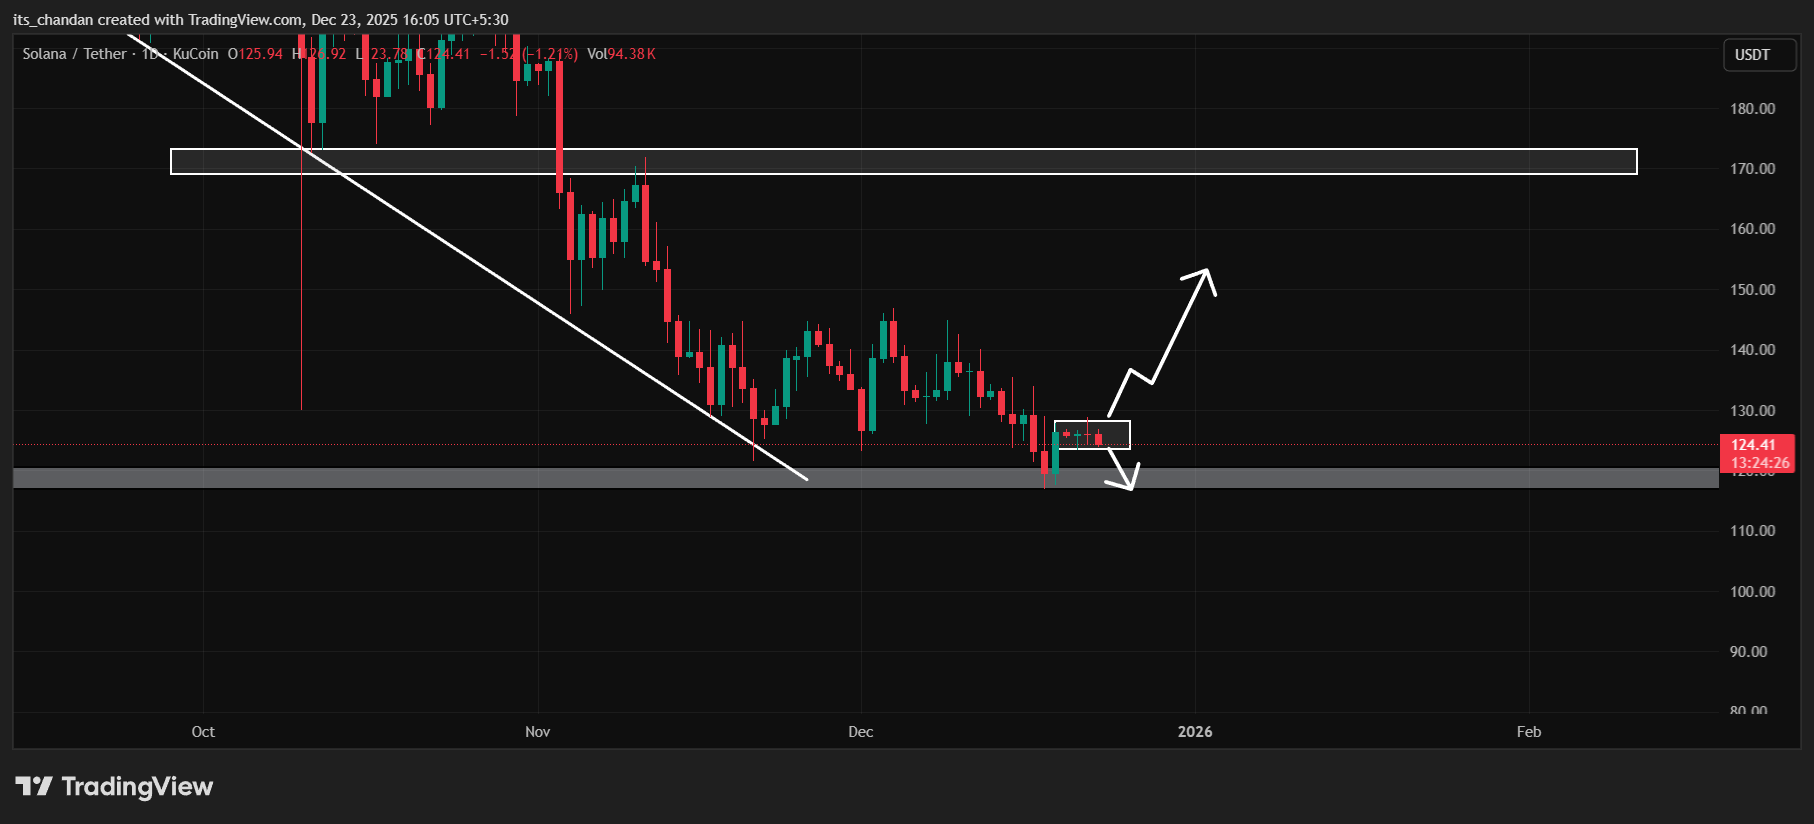
AMBCrypto’s technical analysis of the weekly chart suggested that SOL was at a key support level of $117.
On the daily chart, SOL appeared to be consolidating within a tight range, with support at $123.50 and resistance at $128.23.
If sentiment remains unchanged and the price breaks below the lower boundary of the consolidation range, SOL could see a sharp downside move toward the broader support at the $117 level.
However, an upside rally would only be possible if the SOL price decisively clears the $128.23 level.
Source: TradingView
Final Thoughts
- Intraday traders have built $89.54 million worth of long positions, which are now at risk as the price continues to decline.
- The broader trend remains bullish, as both crypto-native and Wall Street investors maintain a positive outlook, pointing to a potential buying opportunity.


