Date: Tue, Nov 04, 2025 | 10:35 AM GMT
The cryptocurrency market continues to face heightened volatility as both Bitcoin (BTC) and Ethereum (ETH) experienced sharp declines — with ETH dropping nearly 6% in the last 24 hours. Despite this overall market pressure, privacy-focused tokens are quietly attracting investor attention, and Basic Attention Token (BAT) is emerging as one of the standout performers.
The $BAT token — the native utility asset of the Brave Browser ecosystem, a privacy-first web browser — has surged by 13% today. While that price movement is noteworthy, what’s capturing the attention is its chart structure, which closely resembles Dash’s (DASH) explosive ongoing breakout rally.
 Source: Coinmarketcap
BAT Mirrors DASH’s Breakout Pattern
A side-by-side comparison of BAT and DASH on the daily charts reveals a strikingly similar structure, suggesting that a bullish fractal may be repeating.
As seen in the chart, DASH reclaimed its 200-day moving average at the bottom of its formation and later broke above a key resistance, forming a rounding bottom pattern. Once DASH breached its neckline resistance, the breakout triggered an impressive 211% rally, propelling prices to multi-month highs.
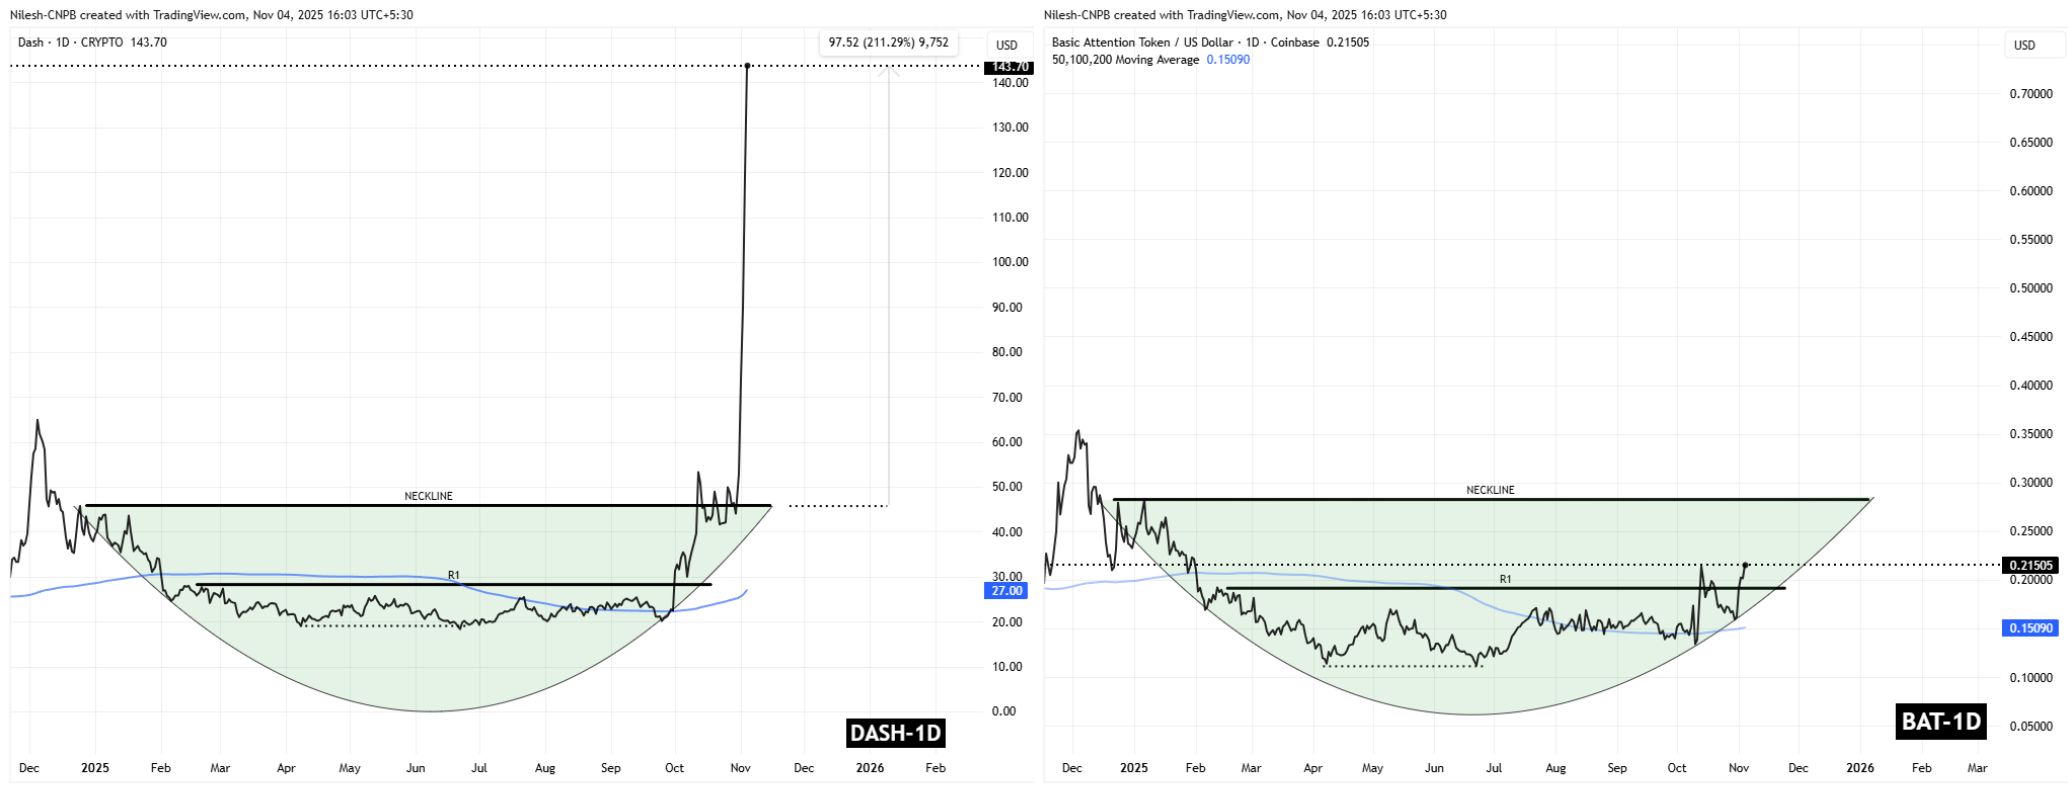 DASH and BAT Fractal Chart/Coinsprobe (Source: Tradingview)
Now, BAT seems to be following the same path. After reclaiming its 200-day moving average and breaking through its R1 resistance, BAT is now approaching its neckline resistance near $0.2824 — the same structural level that ignited DASH’s massive move.
What’s Next for BAT?
If BAT continues to mirror DASH’s fractal behavior, a successful breakout above the neckline could serve as the launchpad for a major rally. The $0.19 zone, which acted as a strong resistance previously, now stands as an important support level for bulls to defend.
A clean breakout above the neckline could push BAT towards the $0.45 region, marking a 60% potential upside from current levels. In a more aggressive scenario — if BAT perfectly replicates DASH’s move — the token could eventually target $0.80, matching the scale of DASH’s 211% surge.
However, traders should note that fractal patterns don’t guarantee identical outcomes. Market liquidity, sentiment, and macro factors could all influence whether this setup fully plays out.