Date: Sat, Oct 25, 2025 | 11:58 AM GMT
The broader cryptocurrency market is showing steady performance today, with Bitcoin (BTC) and Ethereum (ETH) trading mostly flat — yet leaving room for several altcoins to extend gains — including the Kaspa (KAS).
KAS is in green today with modest gains but more importantly, its latest chart formation is displaying a harmonic structure that could set the stage for further bullish momentum in the days ahead.
 Source: Coinmarketcap
Harmonic Pattern Hints at Potential Upside
On the 4-hour chart, KAS appears to have formed a Bearish Bat harmonic pattern — a structure that, despite its bearish name, typically includes a bullish CD leg before price action reaches the Potential Reversal Zone (PRZ).
The formation started at Point X ($0.065950), followed by a drop to Point A, a rebound to Point B, and a retracement to Point C near $0.048000. From that level, KAS has regained strength and is now trading around $0.05414, having successfully reclaimed the 50-hour moving average ($0.05186) — a sign that buyers are reasserting control and momentum is building again.
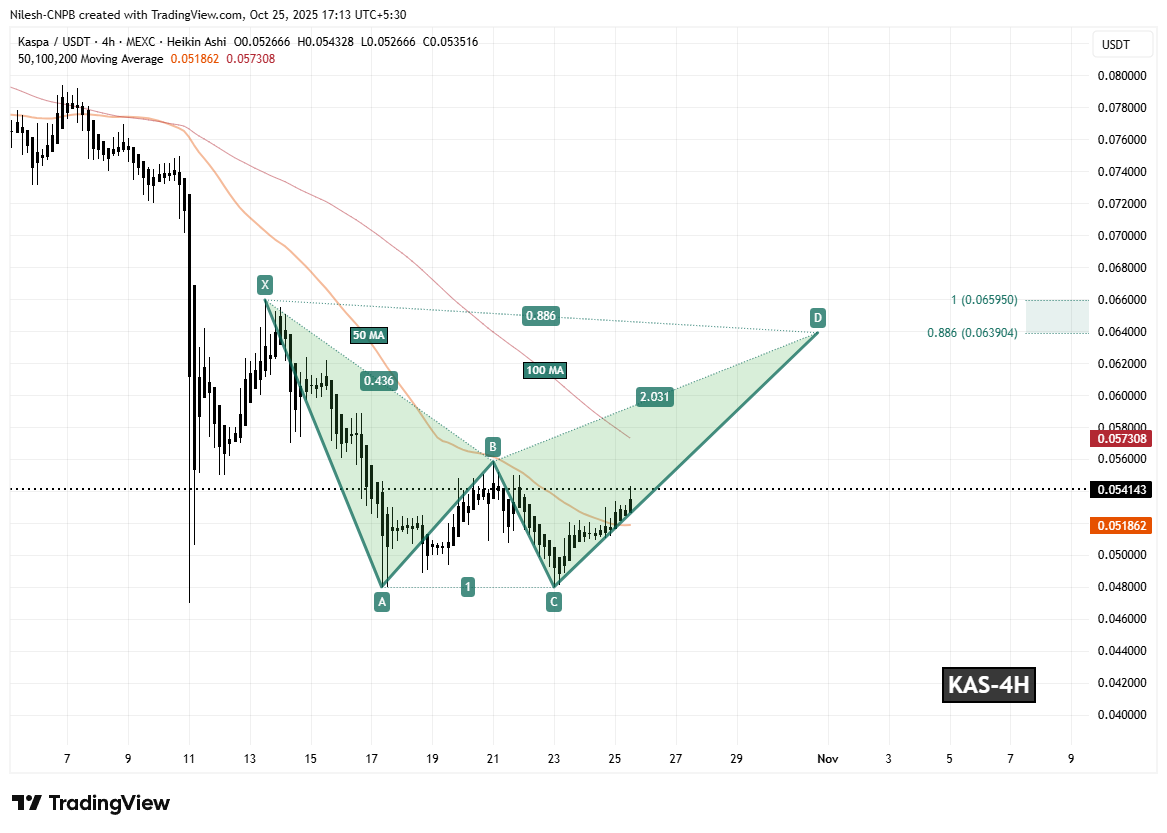 Kaspa (KAS) 4H Chart/Coinsprobe (Source: Tradingview)
The next critical test for bulls lies at the 100-hour MA ($0.05730). A confirmed breakout above this level could validate a continuation of the bullish CD leg, setting up for a potential move toward the PRZ.
What’s Next for KAS?
If bulls manage to defend the 50-hour MA and push KAS above the 100-hour MA, the harmonic pattern suggests a potential upside target between $0.06390 (0.886 Fibonacci extension) and $0.06595 (1.618 extension). These levels represent the completion zone of the Bearish Bat pattern, often acting as key resistance where traders may look to take profits.
On the flip side, if KAS fails to maintain support at the 50-hour MA, short-term momentum could weaken, potentially leading to a period of consolidation before the next bullish attempt.