Date: Thu, Oct 23, 2025 | 10:01 AM GMT
The broader cryptocurrency market continues to show an encouraging tone today, with Bitcoin (BTC) and Ethereum (ETH) both trading over 1% higher, setting the stage for potential upside in several altcoins — including Pump Fun (PUMP).
PUMP is back in green with modest intraday gains, and the latest chart setup suggests there might be more upside ahead. A developing harmonic pattern hints that a short-term bullish continuation could be underway.
 Source: Coinmarketcap
Harmonic Pattern Hints at Potential Upside
On the 4-hour chart, PUMP appears to be forming a Bearish Butterfly harmonic pattern — a structure that, despite its name, often features a bullish rally during its final CD leg before reaching the completion zone.
The pattern initiated from Point X near $0.004566, followed by a sharp correction to Point A, then a rebound to Point B, and finally a dip to Point C around $0.003414. After establishing this low, PUMP has shown renewed strength and is currently trading around $0.003755, reflecting early signs of buying interest returning to the market.
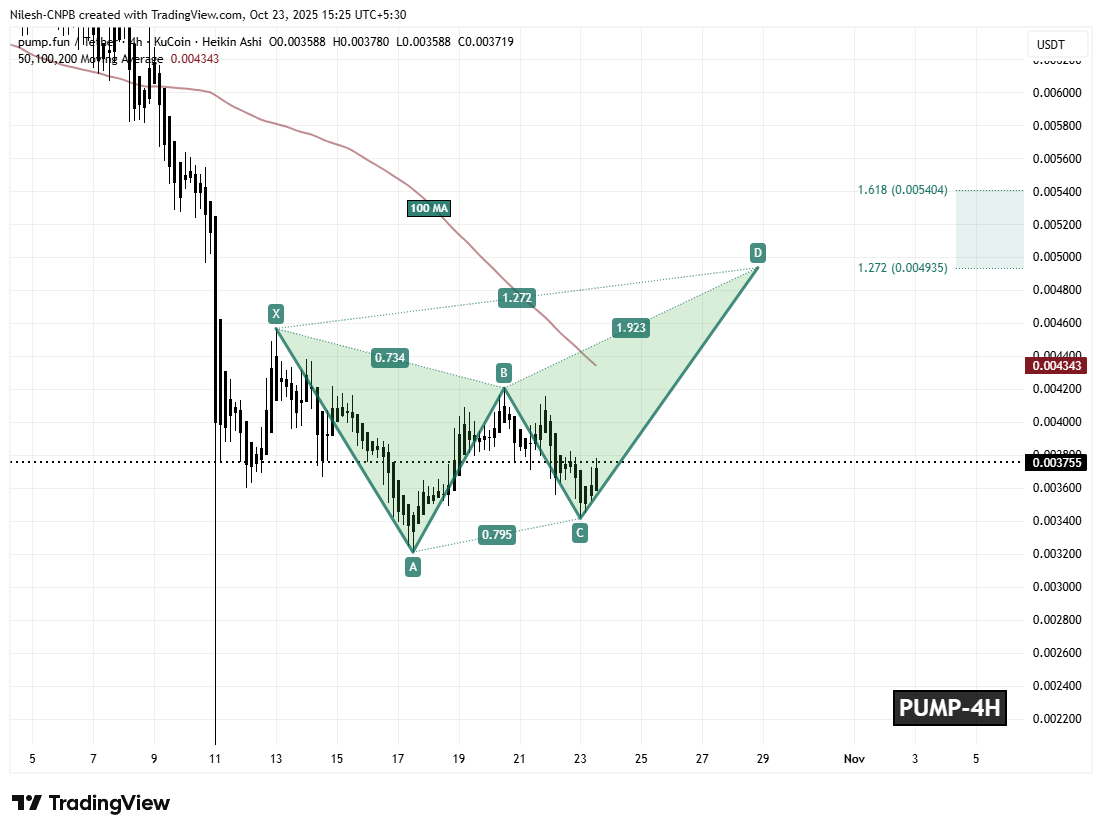 Pump Fun (PUMP) 4H Chart/Coinsprobe (Source: Tradingview)
Crucially, the token is hovering just below its 100-hour moving average (MA) at $0.004343, which acts as a key short-term resistance. A decisive breakout and close above this level could flip it into support — confirming the bullish continuation phase of the Butterfly pattern.
What’s Next for PUMP?
If bulls can sustain momentum above the 100-hour MA, the pattern projects a potential rally toward the Potential Reversal Zone (PRZ), located between $0.004935 and $0.005404. These levels align with the 1.272 and 1.618 Fibonacci extensions, both of which have historically marked completion zones for Butterfly patterns before a reversal phase begins.
However, failure to defend the C-level support at $0.003414 could invalidate the pattern, opening the door for a short-term pullback toward the $0.0031–$0.0030 range before any rebound attempt.