

ETH daily chart (TradingView), created Oct 21, 2025, the structure is a bullish flag.
If price breaks and closes above the flag’s upper rail, the measured move implies about +68% from the current $3,868 toward ~$6,494 (target line shown on the chart).
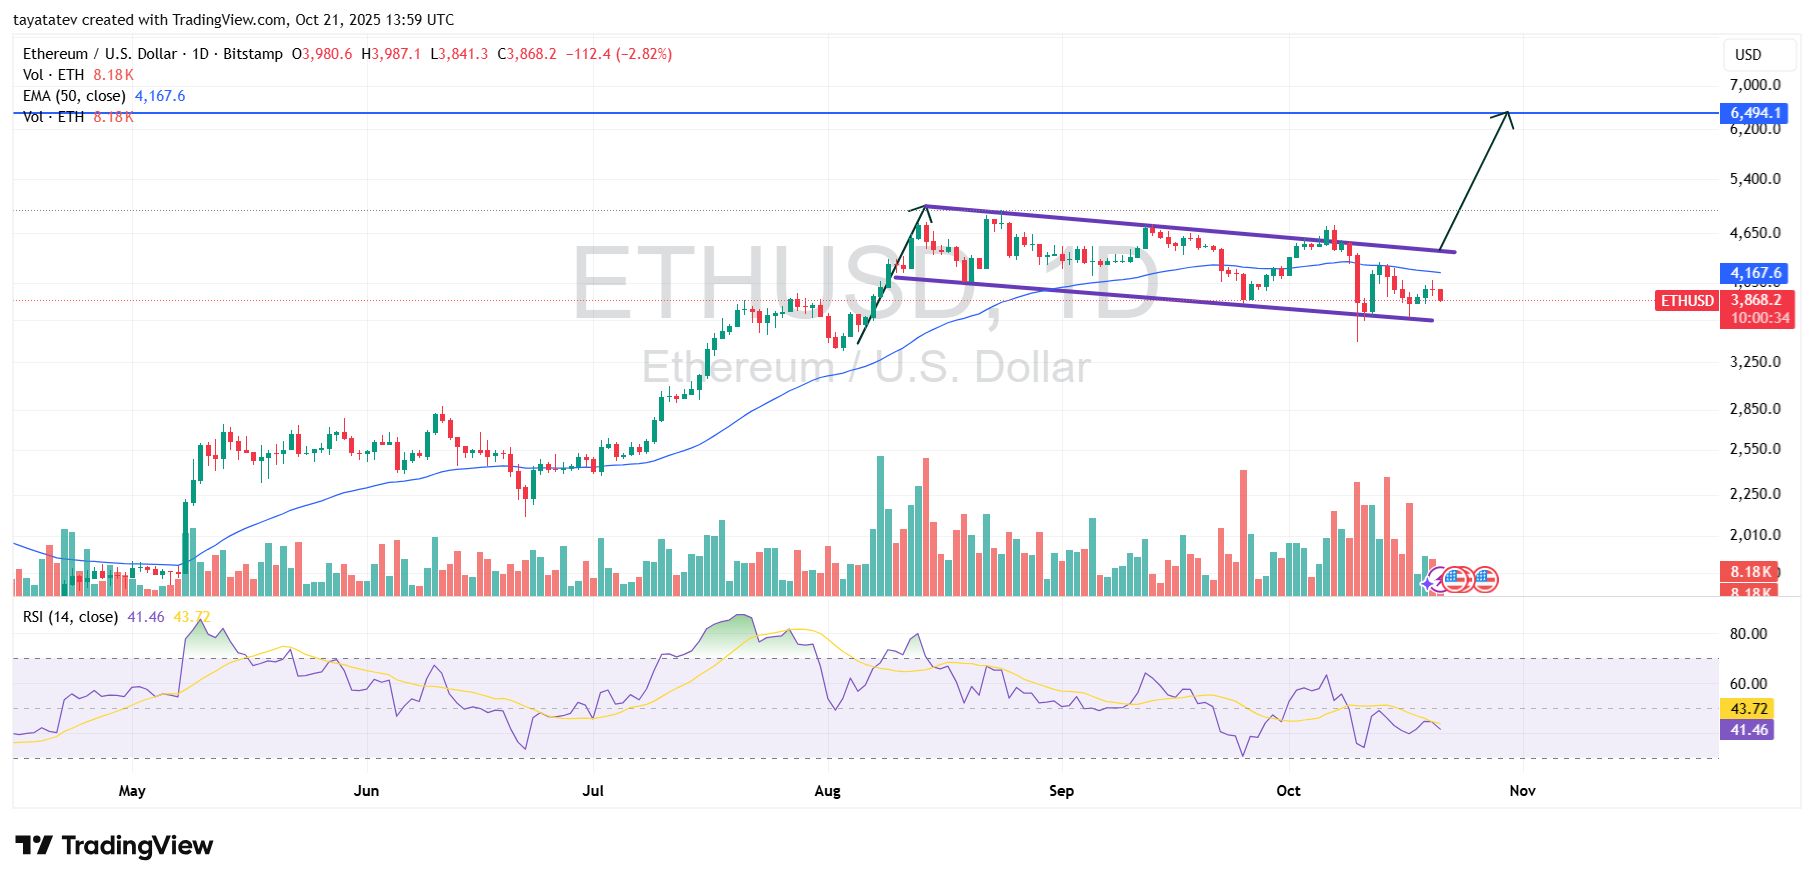 Ethereum Bullish Flag Daily Chart. Source: TradingView
A bullish flag is a sharp rally (“flagpole”) followed by a tidy, downward-sloping, parallel consolidation (“flag”) that often precedes trend continuation.
The evidence on this chart fits that template. ETH ran hard into late summer to form the pole, then slipped into a neat, falling channel with lower highs and lower lows on mostly lighter volume.
That easing volume during the pullback is typical of flags. Meanwhile, the 50-day EMA is $4,167.6, now above spot, and RSI(14) sits near 41–42, showing momentum cooled during the consolidation but stayed mid-range rather than deeply oversold.
Confirmation requires price to break and close above the flag’s upper boundary with expanding volume. On this drawing, that ceiling tracks near the $4,500–$4,650 zone.
Reclaiming the 50-day EMA ($4,167.6) would be an early tell that buyers are regaining control, but the signal completes only on a decisive daily close through the top rail.
If confirmed, the measured move targets the ~$6,494 area. The path would likely meet interim friction first at the EMA, then along the prior swing region around $4.5k–$4.65k, and later near the mid-$5k band before the full projection.
Conversely, a daily close below the lower rail of the channel would weaken or invalidate the flag scenario and shift focus to lower support from the consolidation base.
ETH MACD Shows Ongoing Bearish Momentum on the Daily Chart
Momentum reads negative. The legend shows Histogram −20.5, MACD −110.0, Signal −89.5, meaning the MACD line sits below the signal and the histogram is sub-zero.
That confirms bearish momentum after the brief early-October bounce.
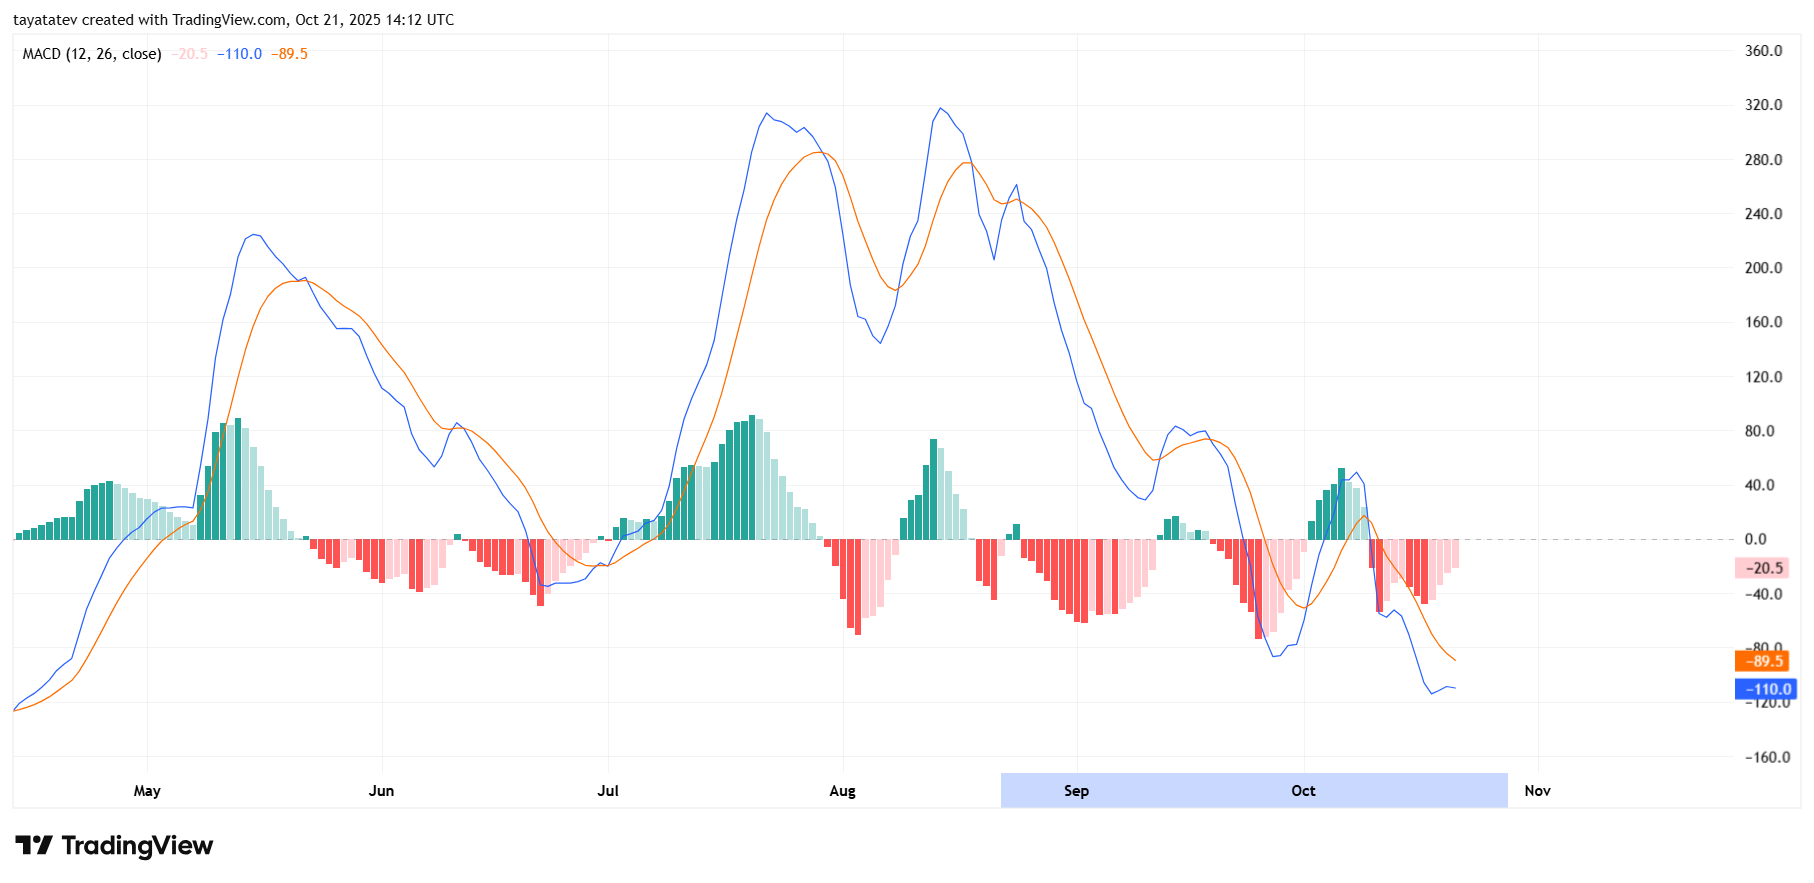 Ethereum MACD Daily Chart. Source: TradingView
The zero line matters. Since mid-September, MACD has lived below zero, only approaching it in early October before rolling back down.
Staying under zero while the histogram deepens red usually aligns with choppy or downward price action.
What would improve the picture. First, watch for histogram contraction toward 0 (red bars shrinking). Next, a bullish cross (MACD climbing back above the signal).
The stronger confirmation comes when MACD reclaims the zero line. That sequence would align with a break from the daily flag on the price chart.
Risk if momentum worsens. If the histogram expands further negative and MACD prints a lower low versus late-September levels, it signals accelerating downside pressure and delays any breakout attempt.

Editor at Kriptoworld
LinkedIn | X (Twitter)
Tatevik Avetisyan is an editor at Kriptoworld who covers emerging crypto trends, blockchain innovation, and altcoin developments. She is passionate about breaking down complex stories for a global audience and making digital finance more accessible.
📅 Published: August 4, 2025 • 🔄 Last updated: August 4, 2025


