
HBAR Price Tests $0.16 Support — One Move Could Trap the Bears

Hedera’s short-term weakness could still flip into strength. Exchange outflows are rising, leveraged shorts are piling up, and a move above $0.19 could decide whether a rebound starts or fades out.
Hedera (HBAR) price is down 4.27% in the past 24 hours and almost 8% this week, trading near $0.16 after losing momentum from last week’s brief rebound. The sideways movement shows hesitation, but two critical trends suggest that the pullback may not last.
If the $0.16 support holds and the price manages to reclaim $0.19, the HBAR price could still recover. Here is how.
Selling Pressure Fades as Bearish Bets Stack Up — Short Squeeze Likely?
The amount of HBAR moving to exchanges has dropped sharply, which usually signals investors are holding instead of selling. Between October 13 and 20, weekly exchange inflows fell from $6.13 million to $1.47 million — a 76% decline.
A similar pattern appeared in late June, when inflows collapsed from $7.72 million to $632,000 (a 90% drop). Within a month, HBAR’s price almost doubled from $0.13 to $0.29.
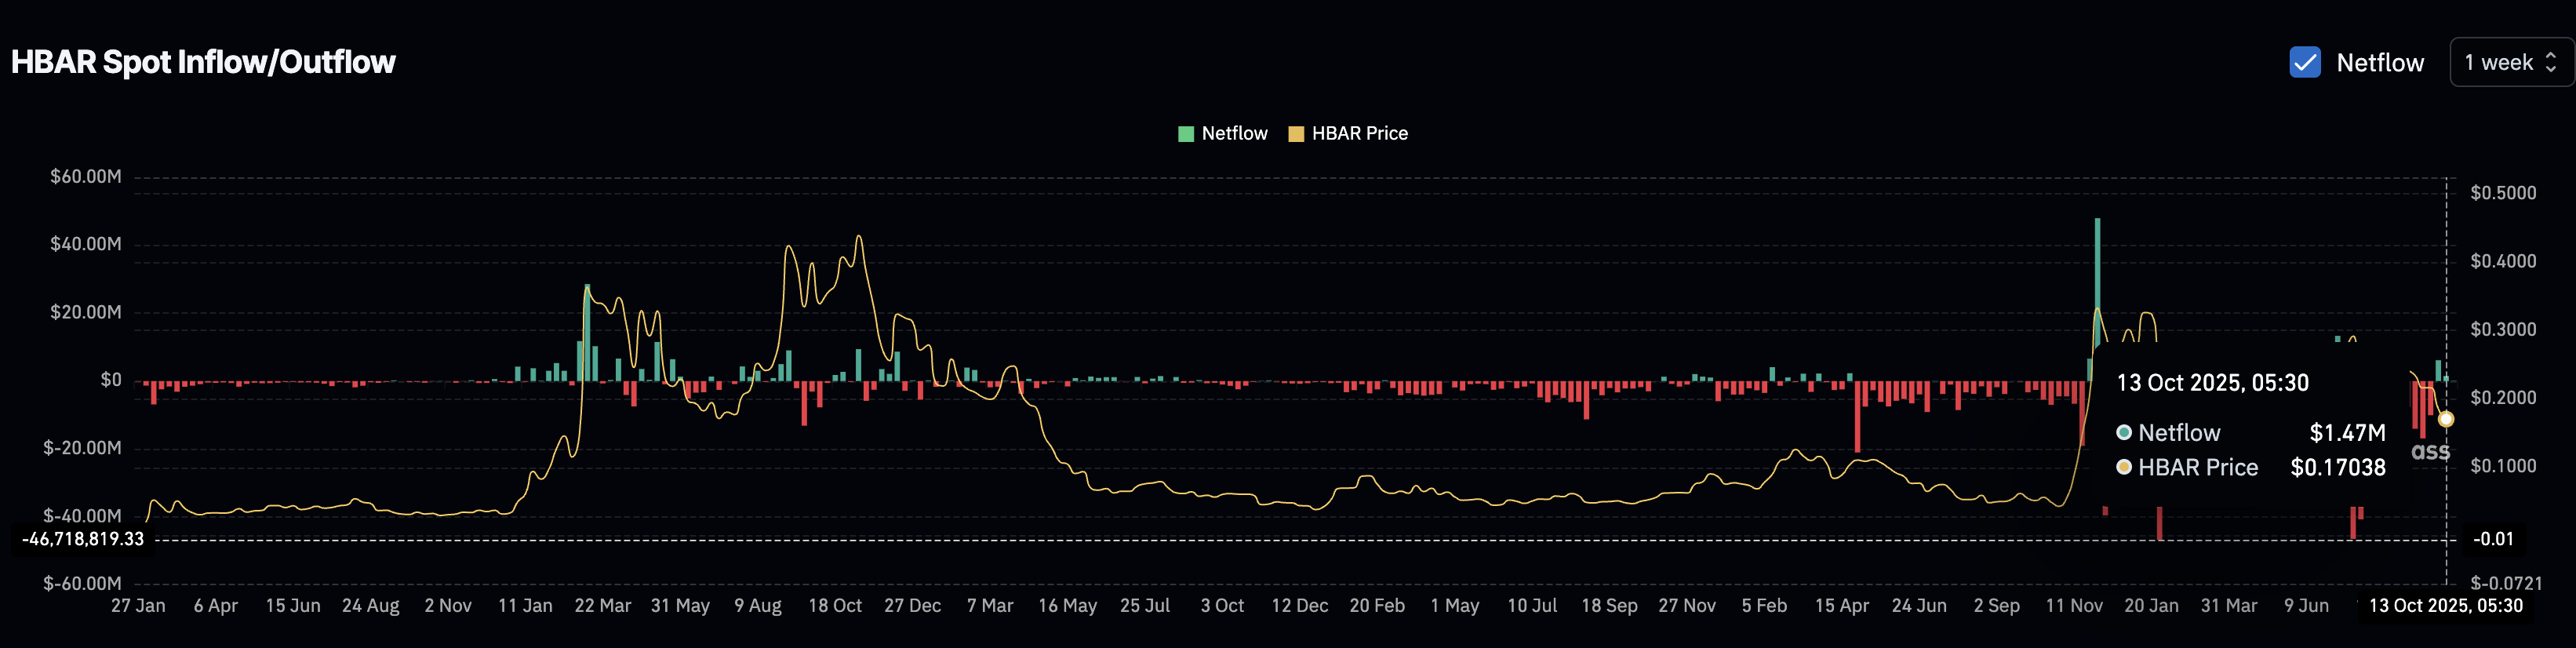 HBAR Netflows Turning Towards Buyers:
At the same time, traders in the futures market are heavily positioned for a drop. Short bets total $44.88 million, compared to only $14.11 million in long positions. This means that 76% of the traders expect more downside, but that imbalance can quickly backfire.
Many short positions will be forced to close if the HBAR price closes above $0.19, where the biggest liquidation cluster sits. A move of about 15% from current prices could trigger buying pressure (via short squeeze) as those shorts unwind.
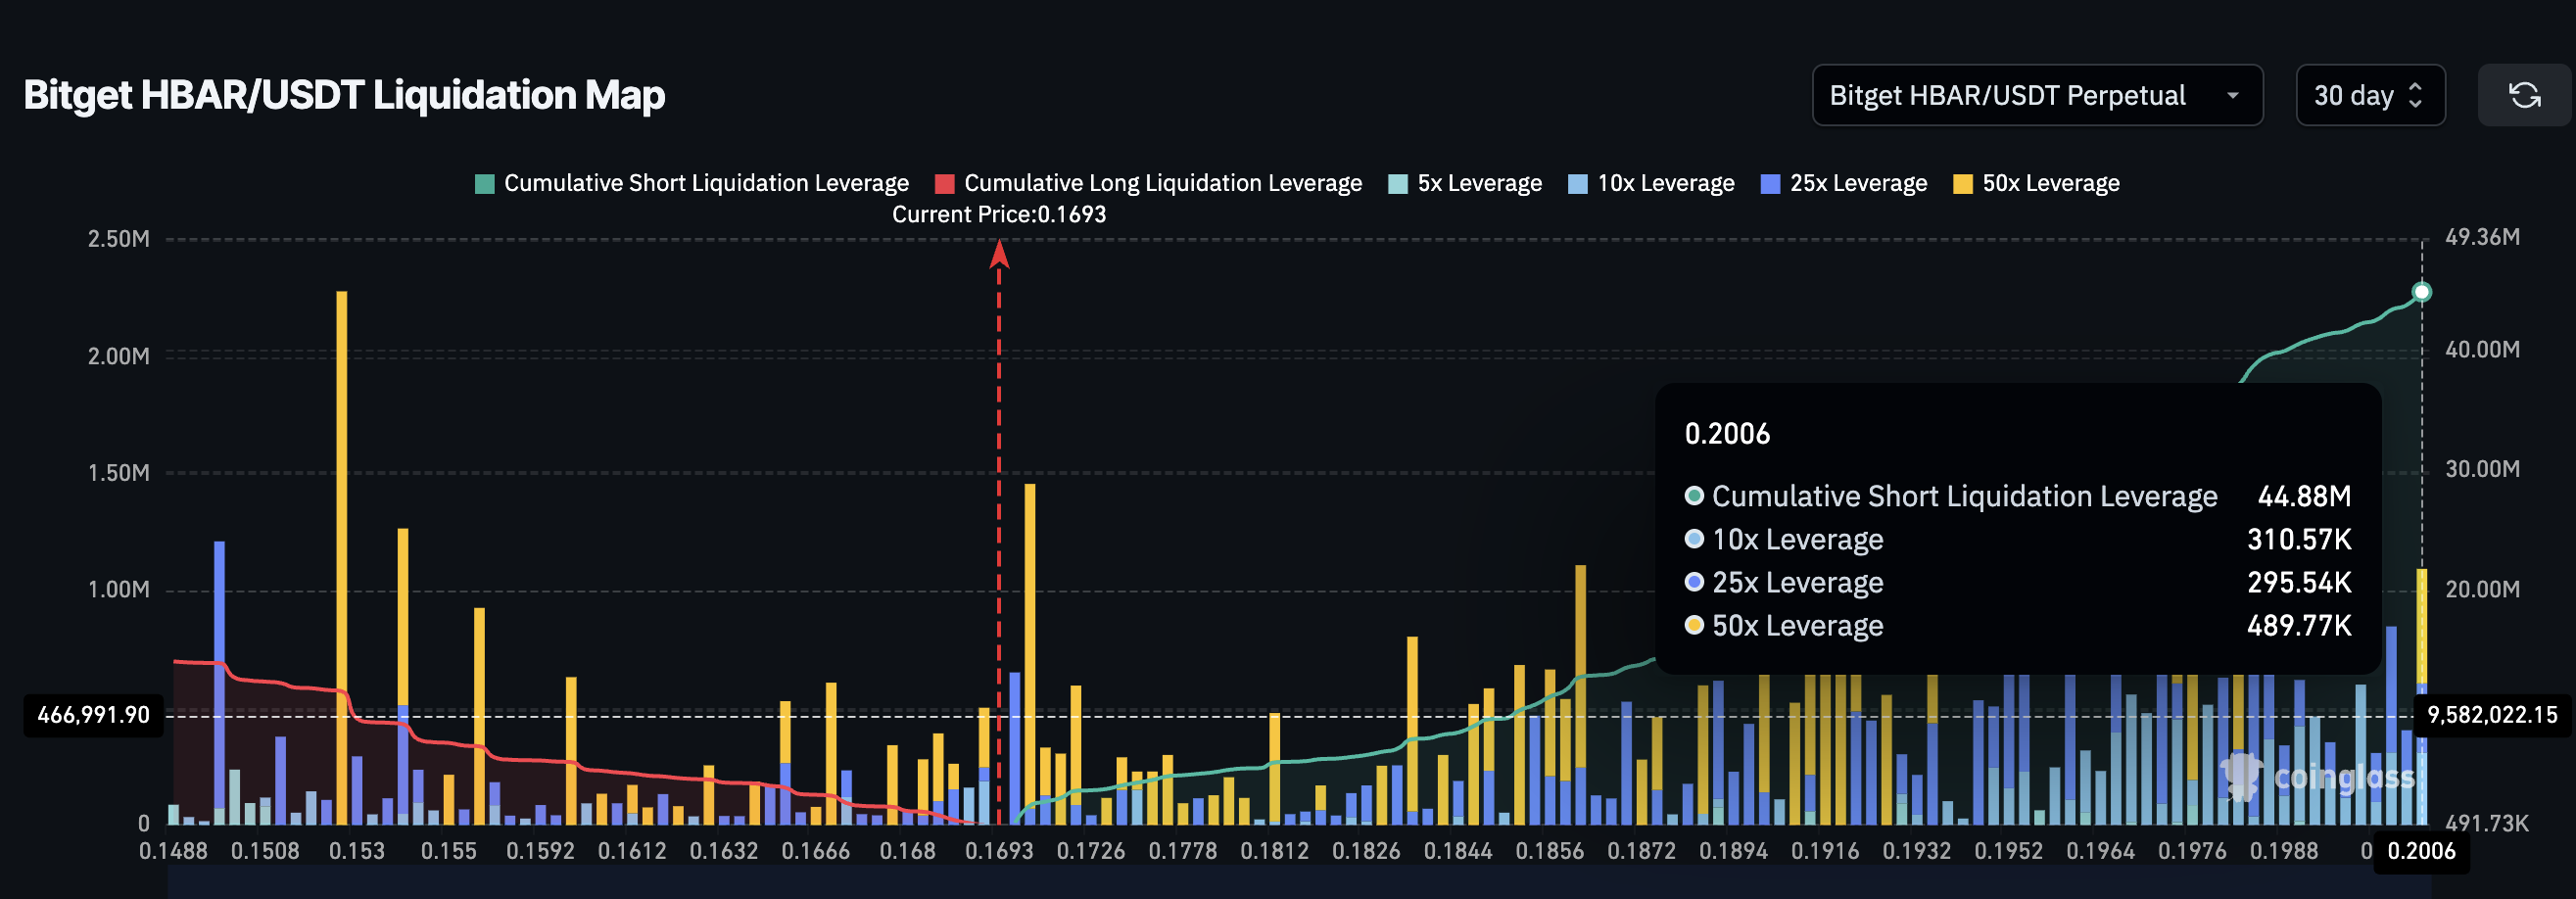 HBAR Liquidation Map:
That mix — less selling on exchanges and too many traders betting against HBAR — could fuel a surprise rally if the price holds above $0.16 long enough to test higher levels.
HBAR Price Needs to Hold $0.16 Before Bulls Can Take Over
HBAR’s price structure still leaves room for recovery, but everything now depends on how it behaves around $0.16 and $0.19. The token continues to trade inside a broadening wedge — a formation where both trendlines move apart, often signaling growing volatility and a potential breakout if buyers regain control.
If HBAR holds above $0.16 and breaks past $0.19, it could climb toward $0.23. A close above $0.23 would mean the price has moved beyond the upper trendline of the broadening wedge. That would potentially trigger the short-squeeze event as leveraged positions unwind. That breakout could pave the way toward $0.25 and $0.30, areas where previous rallies have stalled.
The Relative Strength Index (RSI) — which tracks the speed and strength of price movement — also supports this view. Between June 22 and October 10, HBAR’s price made lower lows while the RSI formed higher lows.
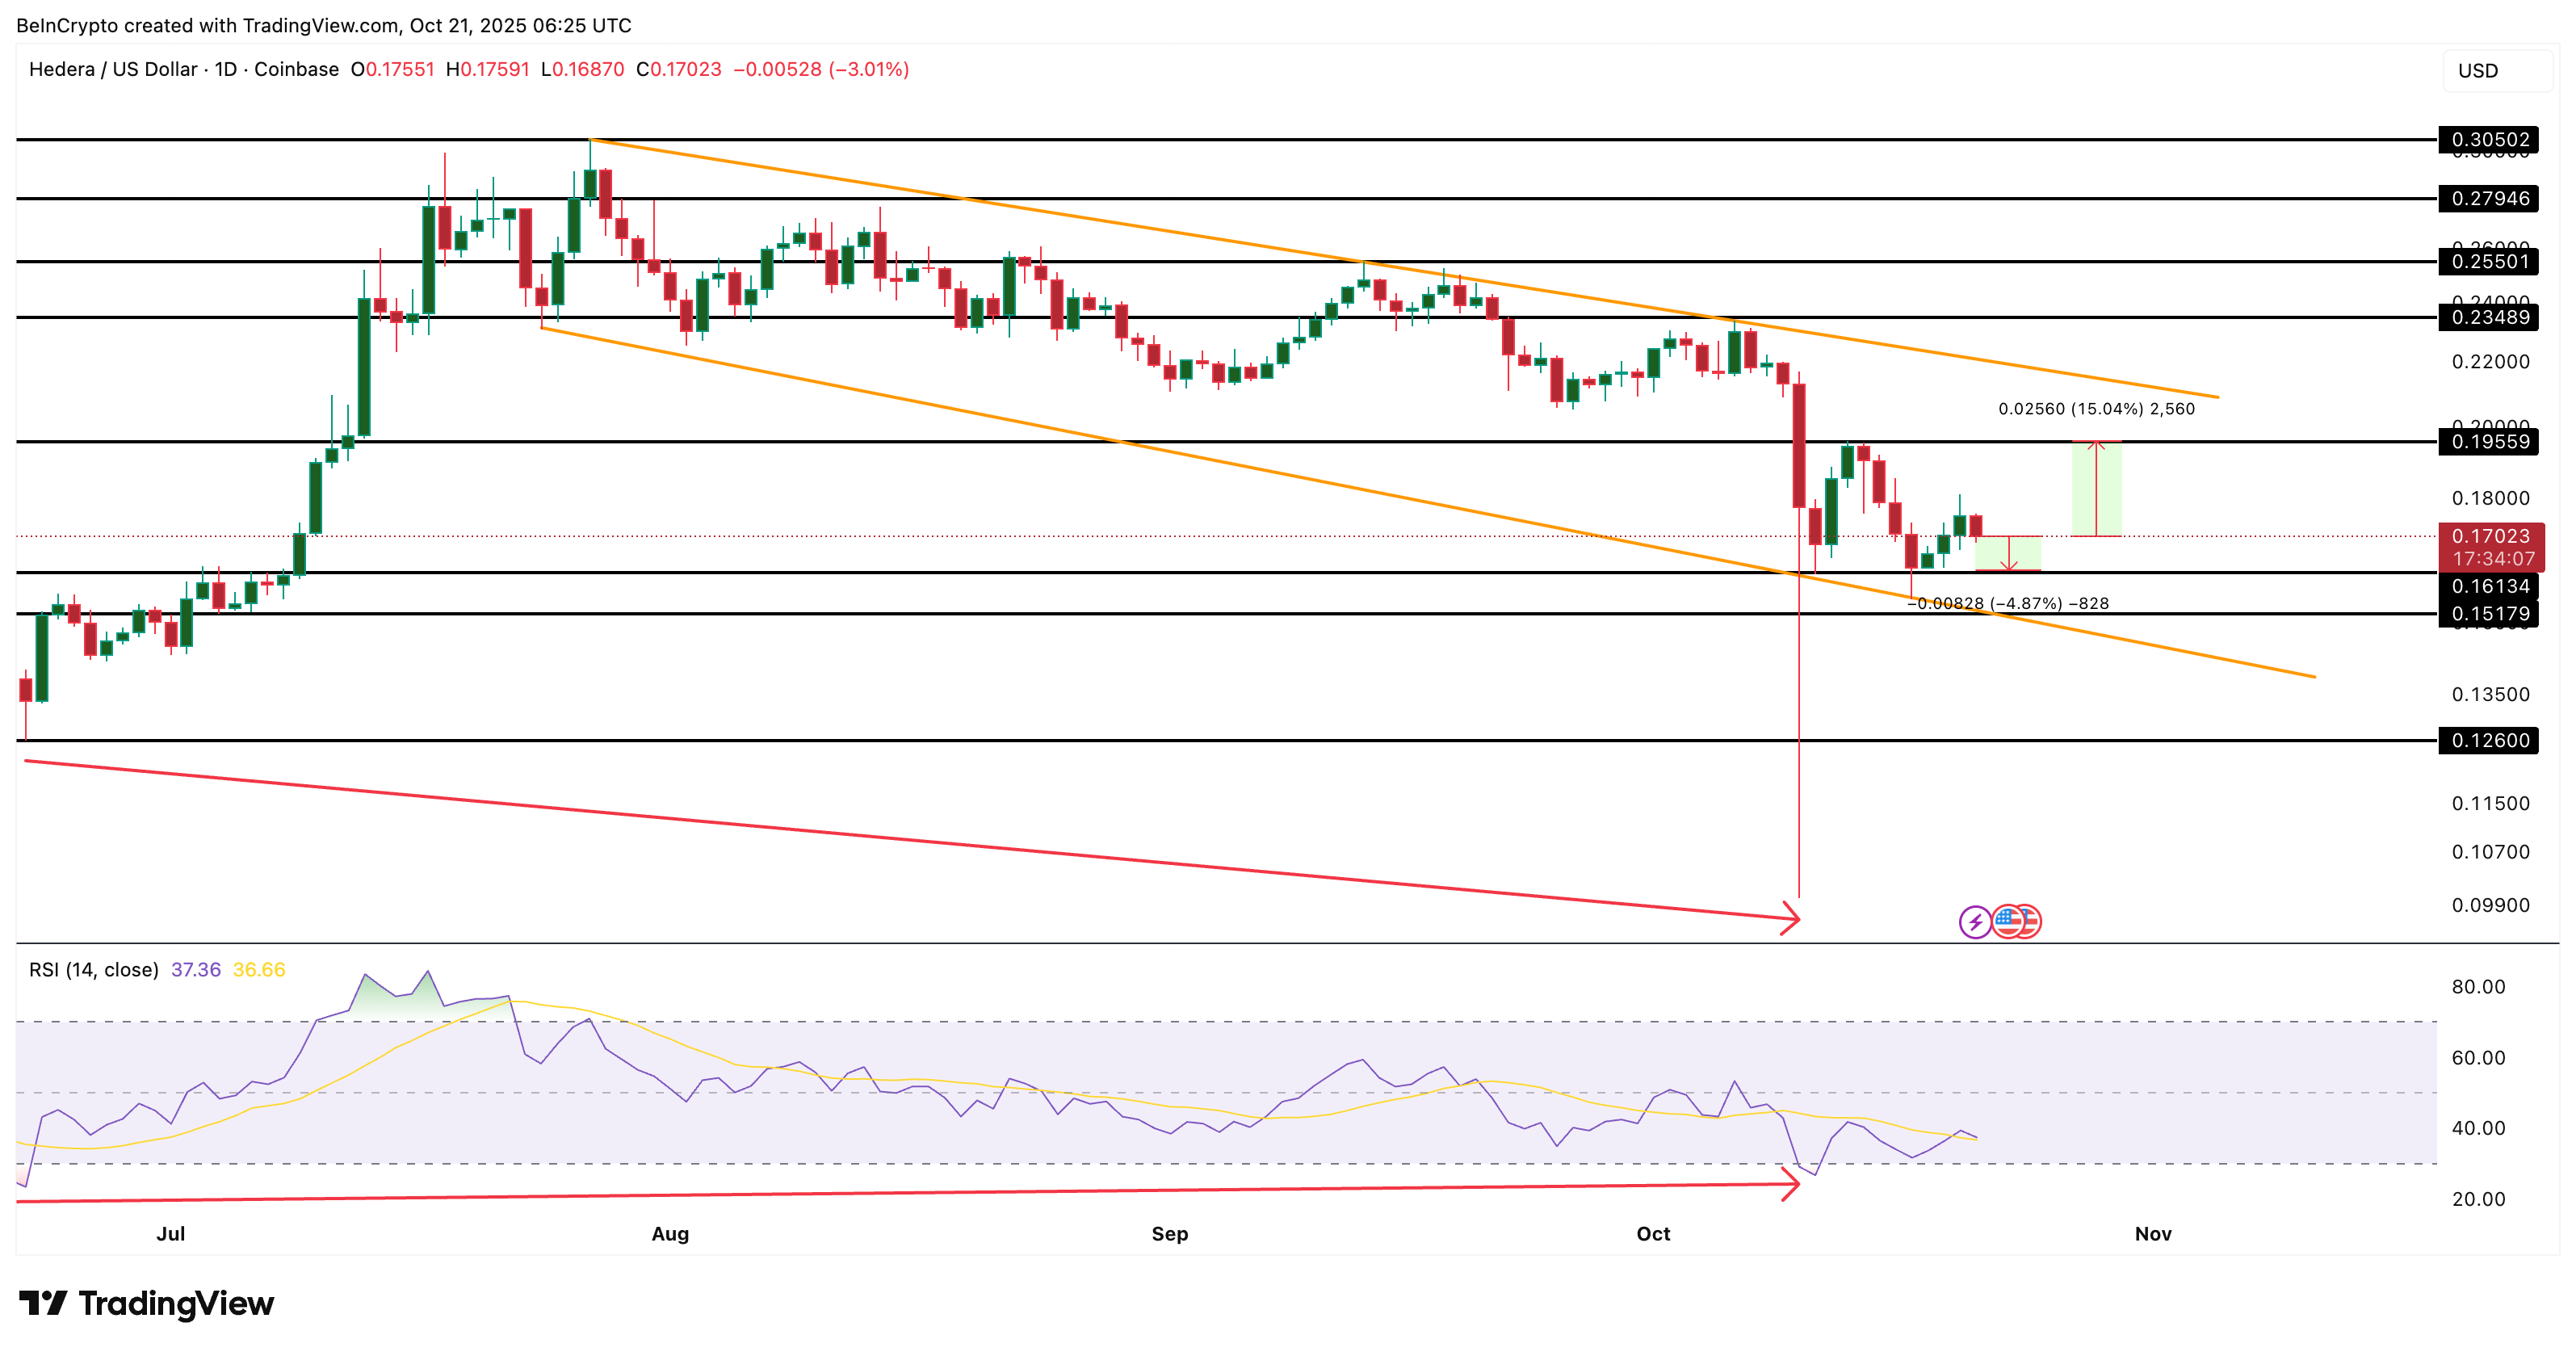 HBAR Price Analysis:
This bullish divergence typically hints that selling pressure is fading even though the price hasn’t yet increased. Combined with a broadening wedge, it strengthens the case for a reversal once HBAR price confirmation arrives.
However, the wedge’s lower trendline is weak since it has only two clear touchpoints. If $0.16 fails and $0.15 breaks, that boundary could give way, dragging HBAR down toward $0.12 and invalidating the rebound setup.
Disclaimer: The content of this article solely reflects the author's opinion and does not represent the platform in any capacity. This article is not intended to serve as a reference for making investment decisions.
You may also like
Societe Generale’s cost-cut plan targets €1.9B in savings by 2029
The "debt black hole" behind the AI boom: $1.2 trillion external financing may be needed in the next five years
The rapid surge of AI is creating an unprecedented "debt black hole": according to Bank of America estimates, total capital expenditure for building AI data centers between 2025 and 2030 will reach as much as $5 trillion, with external financing needs of core cloud giants alone reaching $1.2 trillion to $1.5 trillion. Free cash flow is already running low for giants such as Amazon and Meta, while Nvidia and Broadcom have quietly taken on the role of "implicit guarantors"—marking the beginning of a capital gamble that is set to reshape global credit markets.
Analyst Makes Bold Prediction: Micron (MU.US) Expected to Surpass Microsoft (MSFT.US) in Fiscal Year 2027 Profit; Memory Prices Are the Key Factor
Is Micron (MU.US) expected to earn a net profit of $35 billion in a quarter, surpassing Microsoft's (MSFT.US) profits?
Warning Signs of US Stock Market Crash Reappear as in 2018 and 2022? Fed Tightening and US Treasury Supply Hit Amid Worsening Market Breadth, Liquidity Crisis May Be Approaching
Liquidity pressures may not yet be apparent on the surface of the market, but as market breadth in both stock and bond markets continues to deteriorate, these pressures are steadily accumulating internally.
Crypto prices
More


