

Date: Tue, Oct 21, 2025 | 07:55 AM GMT
The cryptocurrency market has cooled off after an energetic start to the week that briefly pushed Bitcoin (BTC) above the $111K mark before slipping back toward $108K. Ethereum (ETH) also dropped over 4% amid renewed tariff concerns, dragging down major altcoins — including Sui (SUI).
The layer-one token has slipped by over 5% today, but beneath this short-term dip lies something noteworthy — SUI’s current price structure appears to be echoing a bullish fractal that Solana (SOL) displayed just before its major breakout in late 2024, hinting that history could be setting up to repeat itself.
 Source: Coinmarketcap
Fractal Setup Hints at a Bullish Breakout
As illustrated in the chart, SUI’s price action over the past few months closely resembles Solana’s late-2024 consolidation phase. Back then, SOL was locked in a descending triangle pattern, repeatedly testing its base support zone while trading below the 200-day moving average.
That pattern ultimately resolved with reclaim of 200-day MA and a breakout from triangle, triggering a sharp 46% rally that flipped sentiment from bearish to bullish.
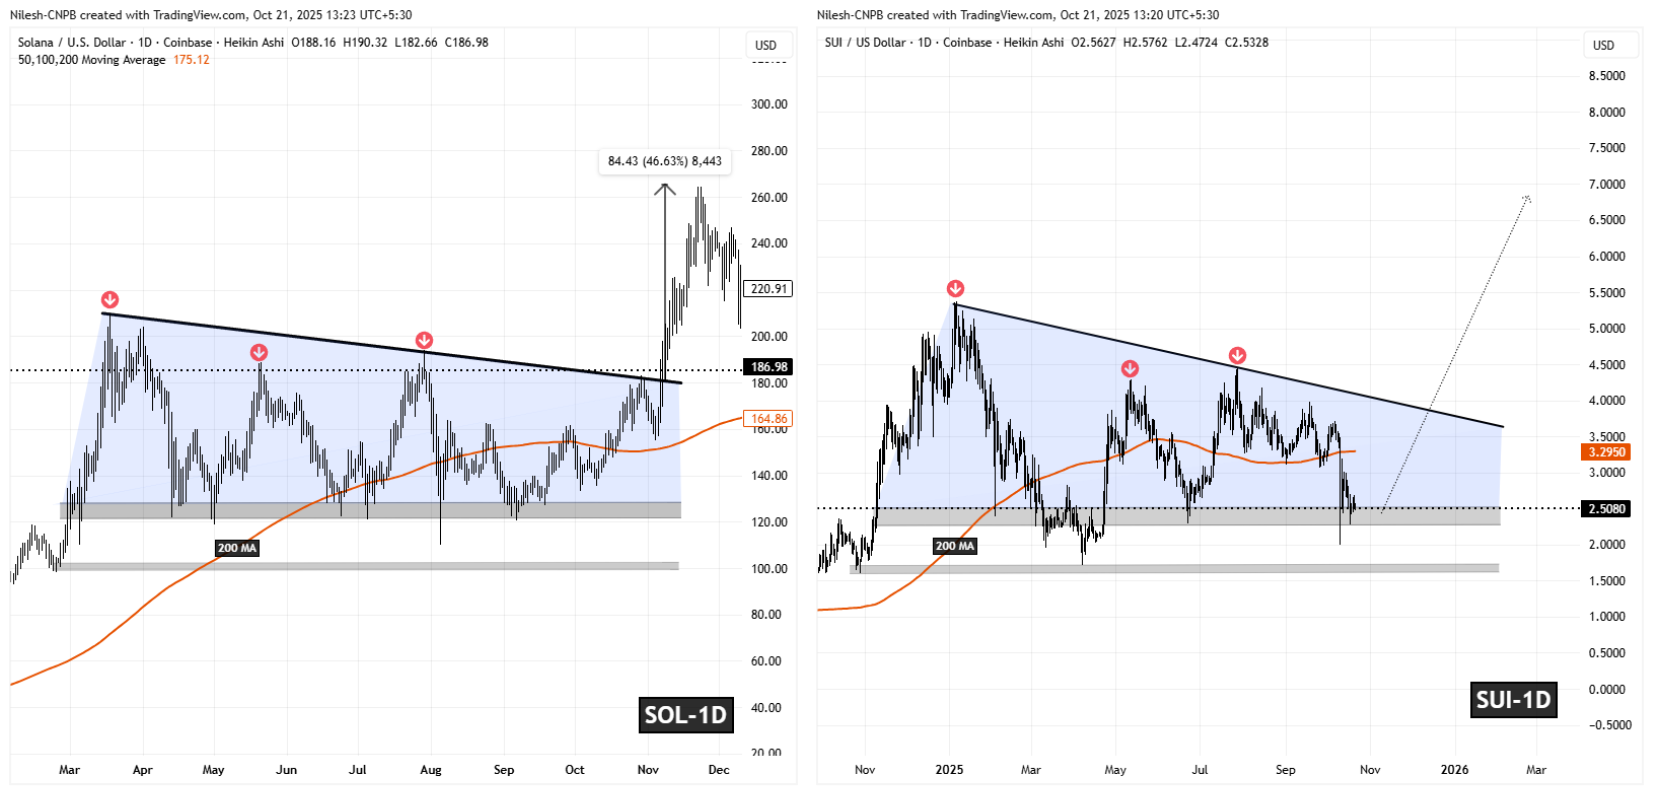 Source: SOL and SUI Fractal Chart /Coinsprobe (Source: Tradingview)
Now, SUI seems to be tracing that same path. The token has also formed a descending triangle structure and is currently testing a crucial support range between $2.26 and $2.50 — a level where early signs of buyer resilience are emerging.
What’s Next for SUI?
If SUI continues to follow SOL’s previous fractal behavior, the current zone could mark an accumulation phase before a larger upside move. A stable hold above this support area could pave the way for a retest of the 200-day moving average near $3.29.
A successful reclaim of that level would strengthen the bullish outlook, potentially setting up SUI for a breakout above its descending resistance trendline. Once confirmed, this move could initiate a rally toward the $6.80–$7.00 region, mirroring the kind of explosive move SOL experienced after its breakout.
However, traders should remain cautious — fractals offer clues based on historical symmetry, not certainties. Market conditions, sentiment shifts, and macro developments could all influence SUI’s trajectory in the short term.


