

Date: Mon, Oct 20, 2025 | 01:58 PM GMT
The cryptocurrency market is off to a strong start this week after a period of choppy momentum last week. Both Bitcoin (BTC) and Ethereum (ETH) are trading in the green, posting impressive gains of over 3% — lifting sentiment across major altcoins, excluding Ethena (ENA).
While ENA is currently trading slightly in red, the bigger picture still paints a constructive bullish structure: the token has broken out from a key pattern and is now undergoing what looks like a textbook retest of that breakout level.
 Source: Coinmarketcap
Retesting Bump-and-Run Reversal (BARR) Breakout
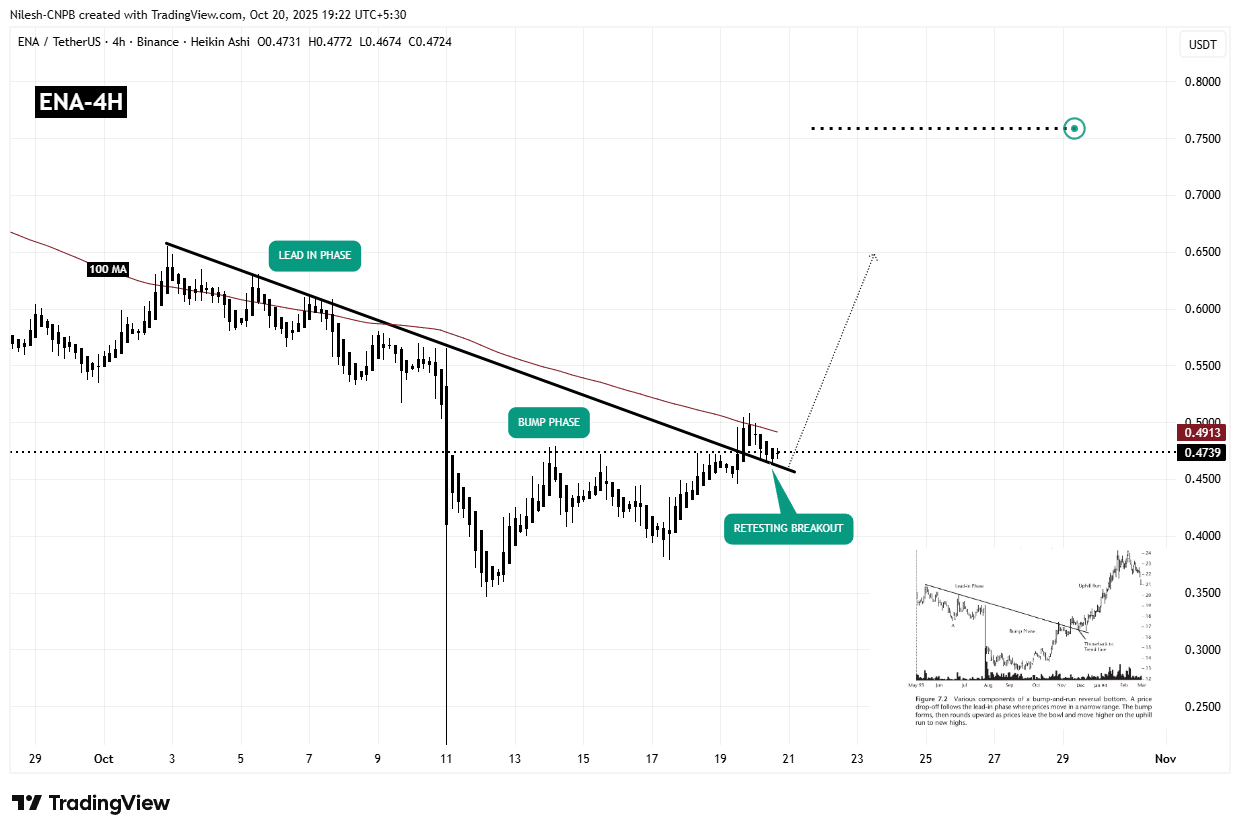
On the 4-hour chart, ENA is forming a Bump-and-Run Reversal (BARR) pattern — a classic setup that often indicates a shift from bearish to bullish momentum.
The pattern typically develops in three key stages: the Lead-in phase, where prices trend downward steadily; the Bump phase, marked by an accelerated selloff; and finally, the Run phase, where a strong reversal emerges after breaking the descending trendline.
In ENA’s case, the breakout above the downtrend line occurred near $0.4737, signaling a potential end to the correction phase. Following this breakout, ENA briefly rallied to $0.5077, before encountering minor selling pressure that pulled it back toward the breakout line.
 Ethena (ENA) 4H Chart/Coinsprobe (Source: Tradingview)
Currently, ENA is retesting this breakout level, hovering around $0.4739 — a crucial zone where buyers typically step in to confirm trend reversal strength.
What’s Next for ENA?
If bulls successfully defend this support region, it could validate the BARR setup and trigger the next leg higher. A sustained move above $0.5077 (local high) and the 100-hour moving average would likely accelerate upside momentum.
From a pattern-projection standpoint, ENA’s BARR structure points to a potential target near $0.7588, representing an upside of nearly 60% from current levels.
However, if ENA closes decisively below the breakout support trendline, the breakout confirmation could weaken, suggesting a possible consolidation phase before another attempt higher. For now, the chart structure remains technically bullish, and traders are closely watching the ongoing retest as a make-or-break moment for ENA’s next directional move.


