

Date: Mon, Oct 20, 2025 | 04:44 AM GMT
The cryptocurrency market is showing strength as the new week begins, following a period of choppy and uncertain price action last week. Both Bitcoin (BTC) and Ethereum (ETH) are trading in the green, posting gains of over 2% and 3%, respectively — helping boost sentiment across major altcoins, including Avalanche (AVAX).
AVAX is currently showing modest gains, but its latest chart formation hints that a larger bullish move could be brewing beneath the surface.
 Source: Coinmarketcap
Bump-and-Run Reversal (BARR) Pattern in Focus
On the 1-hour chart, Avalanche’s price action is closely resembling a Bump-and-Run Reversal (BARR) pattern — a relatively rare but powerful technical setup that often signals a shift from bearish to bullish momentum.
The Lead-in Phase began when AVAX was rejected from its descending trendline near the $24.05 range, sparking a sharp correction that pushed prices down to form the Bump Phase bottom around $19.02.
From that low, AVAX has rebounded strongly, breaking above the downtrend resistance before pulling back slightly — a move that aligns with a classic throwback retest seen in many successful reversal setups.
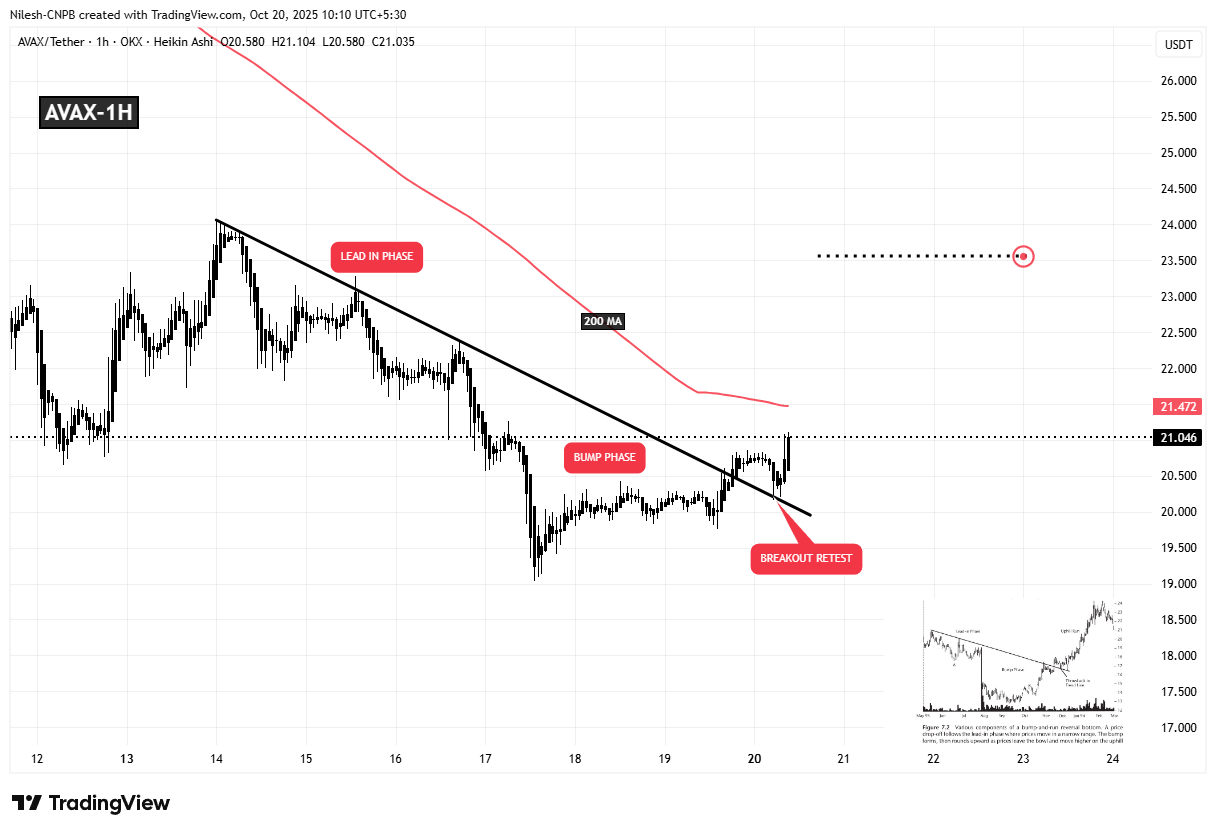 Avalanche (AVAX) 1H Chart/Coinsprobe (Source: Tradingview)
At press time, AVAX is trading near $21.04, hovering just below its 200-hour moving average (MA) at $21.47. This moving average now serves as a key pivot point. A decisive close above this level could confirm the bullish breakout and potentially mark the start of the Uphill Run Phase.
What’s Next for AVAX?
If the BARR pattern continues to play out, a confirmed move above the 200-hour MA could propel AVAX toward the $23.56 zone — the projected technical target for the pattern, representing an estimated 11% upside from current levels.
However, failure to maintain strength above the moving average could trigger a brief consolidation period. Still, as long as AVAX holds above the $19 support zone and maintains its broader structure, the bias remains tilted toward further upside momentum.
For now, Avalanche’s setup looks encouraging, and traders will be closely watching whether this reversal pattern translates into a sustained rally in the sessions ahead.


