
Bitcoin Price Relies on This 3-Month Low Signal to Go Bullish — If $114,900 Breaks

Bitcoin price prediction suggests a breakout may be near as on-chain data and chart signals align. With BTC trading around $111,346, a daily close above $114,928 could confirm a move toward $117,615 and $121,440. Meanwhile, holders are accumulating again, and the NUPL recovery from its 0.48 low supports renewed market optimism.
Bitcoin (BTC) is up nearly 4% in the last 24 hours, trading around $111,346, extending the broader market’s recovery. Despite the rebound, the Bitcoin price remains down 3.8% over the past 30 days, showing that the bullish comeback is still in progress.
However, both on-chain metrics and technical signals suggest that Bitcoin might be gearing up for a stronger push if key resistance levels are cleared.
More Holders Are Buying Again as Market Confidence Slowly Returns
The Holder Accumulation Ratio (HAR), which measures how many active holders are increasing their positions versus reducing them, shows improving confidence.
Although the ratio trended down since September 13, reaching a low of 52.91% in early October, it has since rebounded to 55.53%, signaling renewed accumulation behavior.
When this ratio stays above 50%, it typically means long-term Bitcoin holders are buying more than selling – a bullish sign.
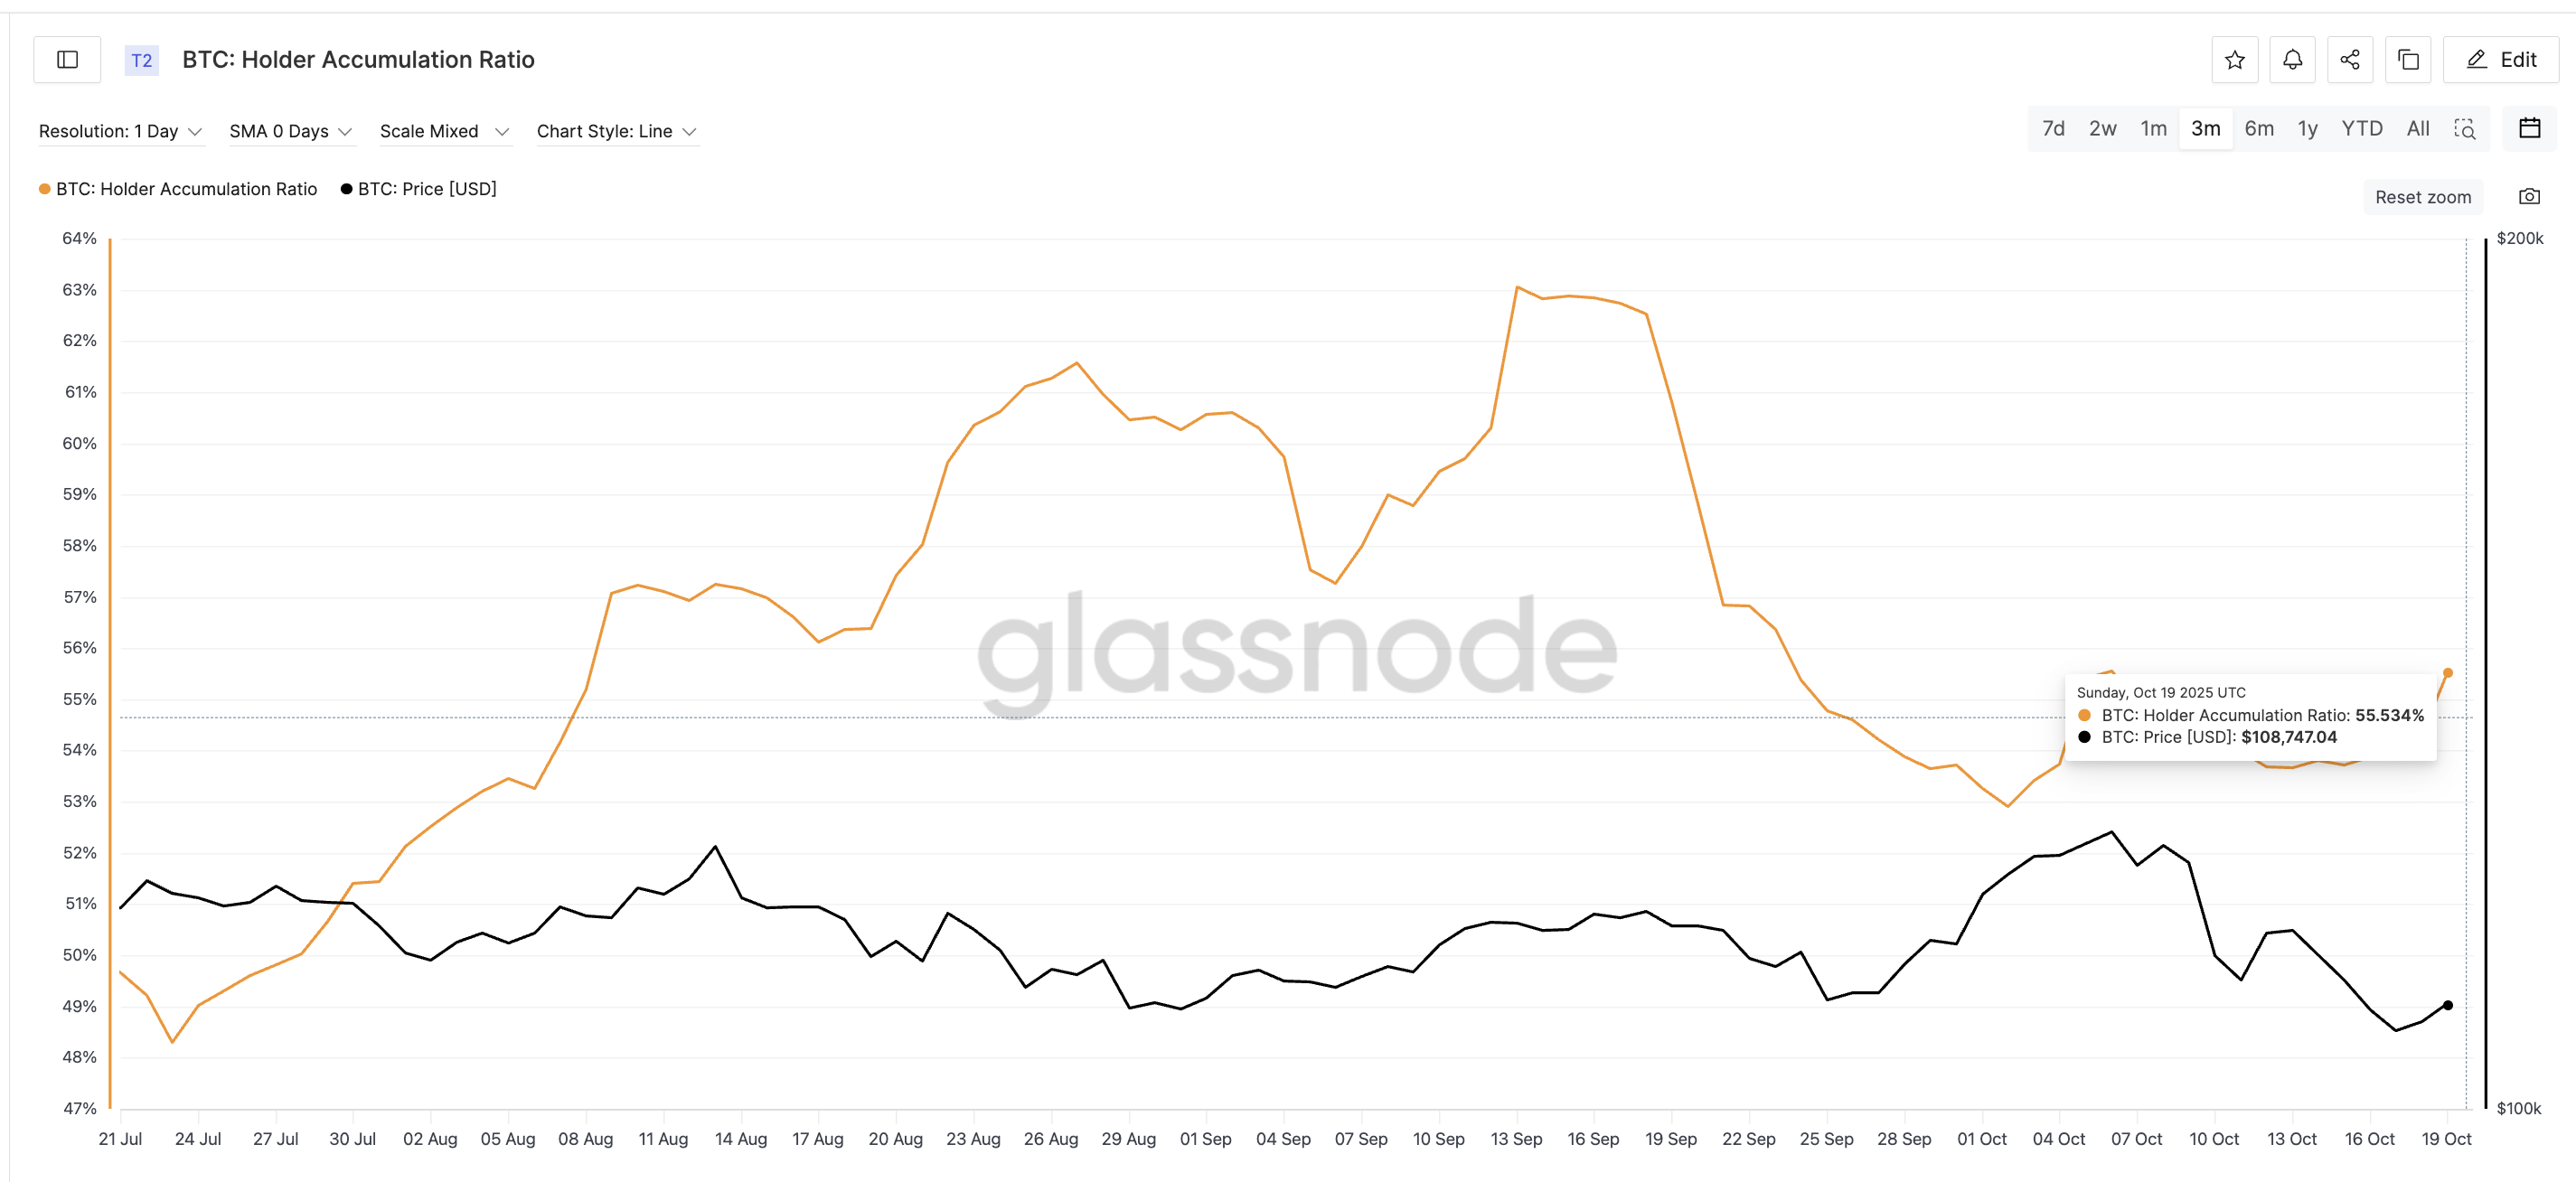 BTC Holders Still Accumulating:
The Net Unrealized Profit/Loss (NUPL), which tracks whether the market is in profit or loss, also supports this view. After hitting a three-month low of 0.48 on October 17, it has begun to turn upward.
As NUPL is still under 0.50 and near the 3-month low, profit-taking doesn’t look like an immediate hurdle.
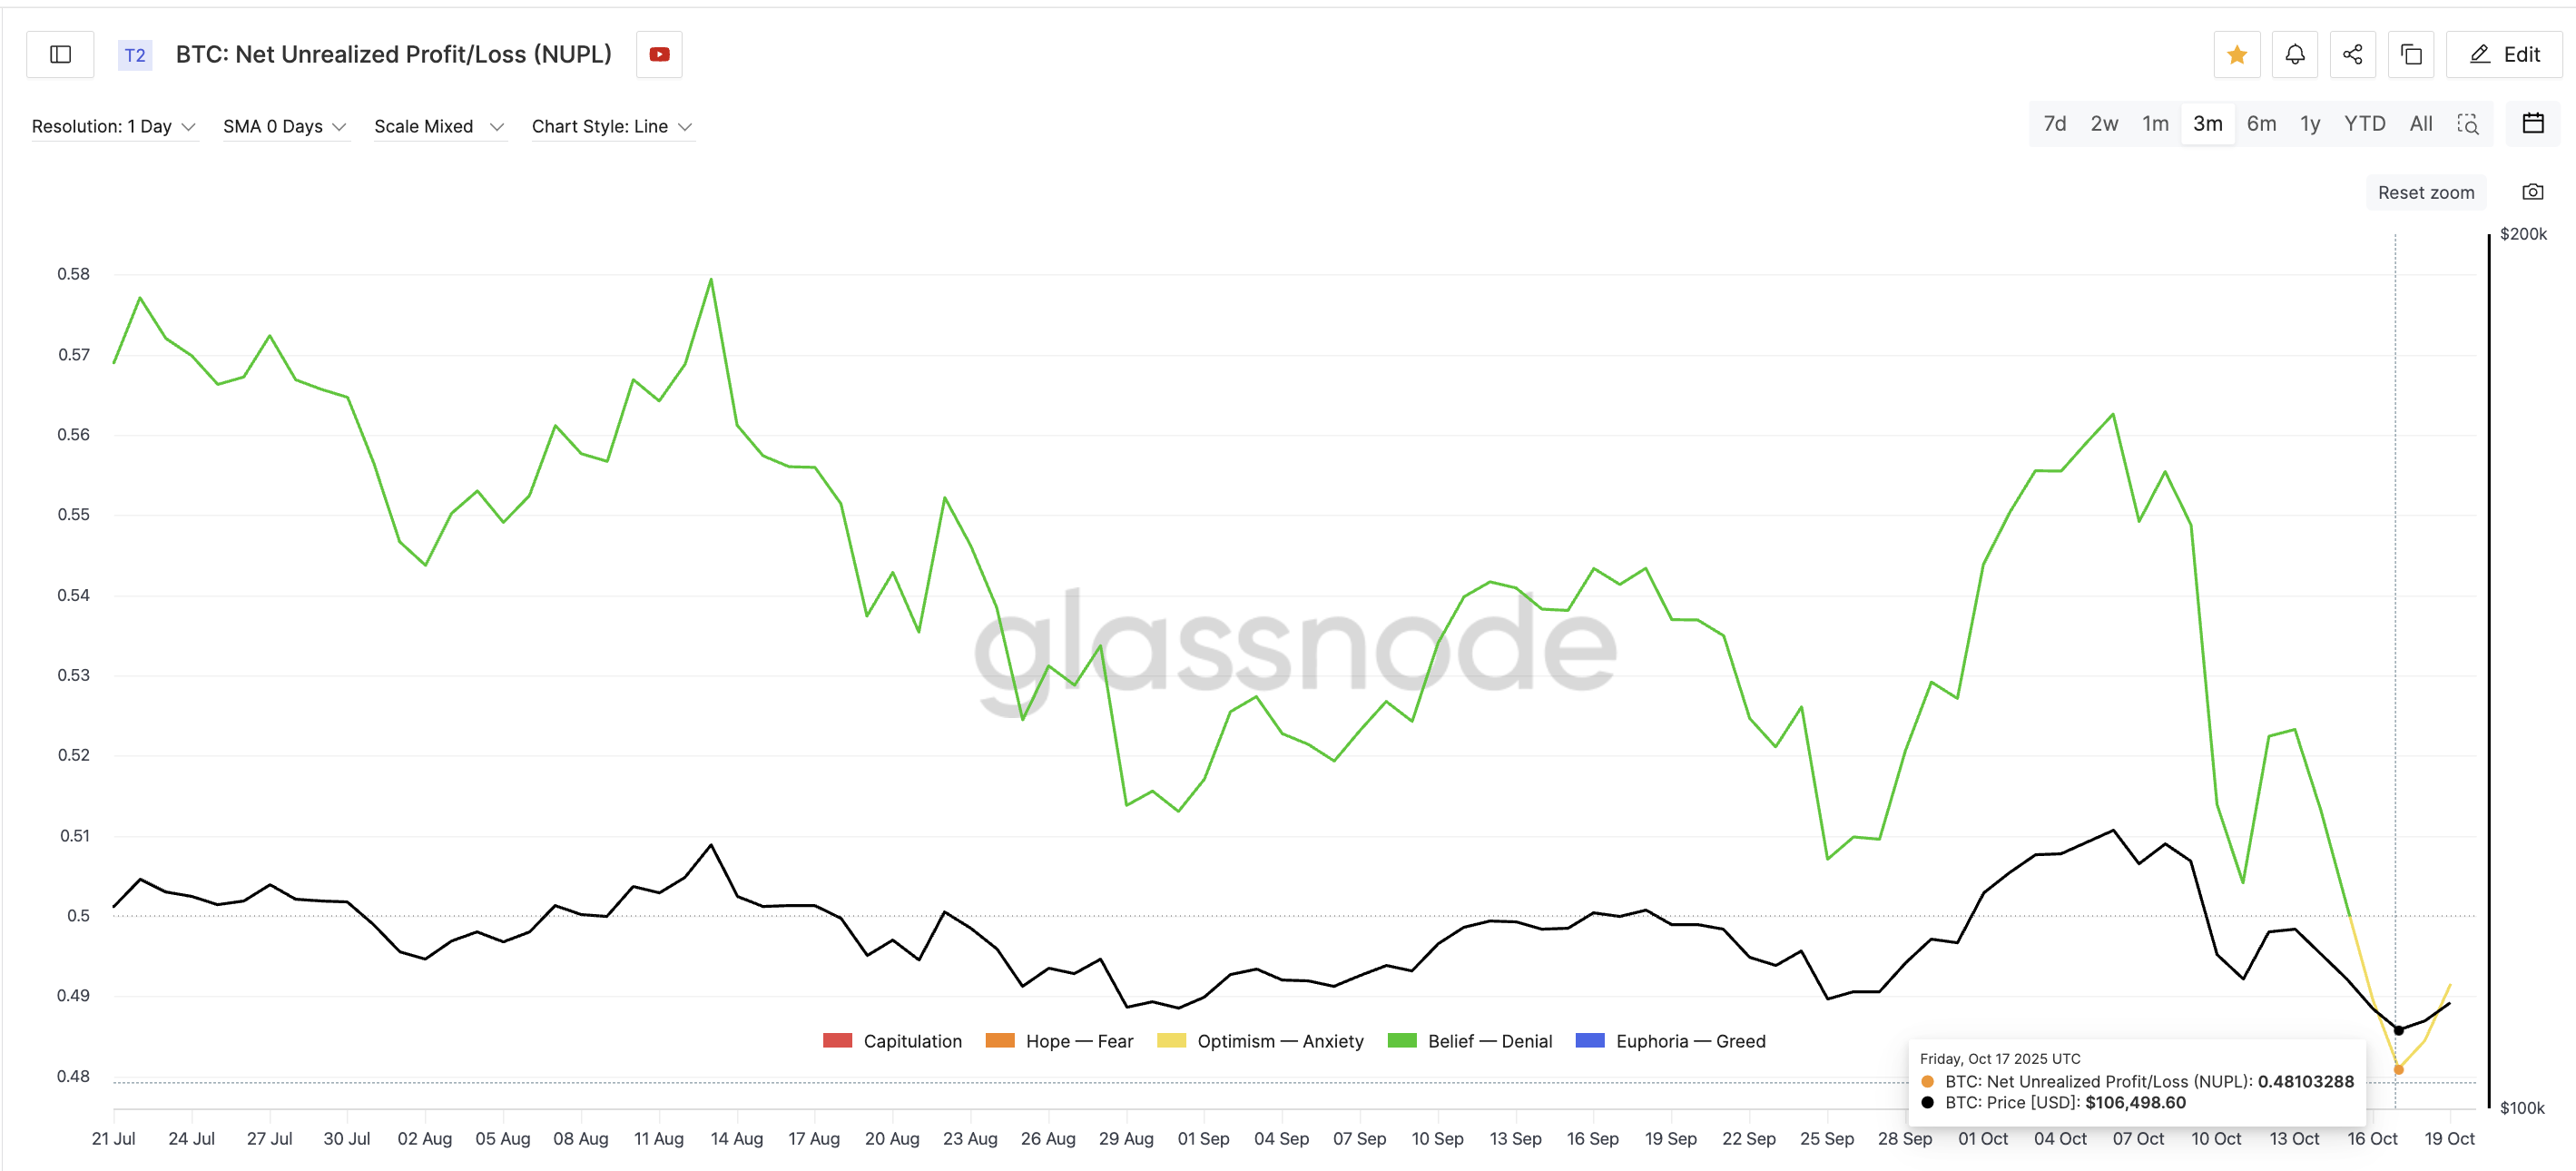 BTC Profit Booking Incentive Is Low:
Historically, a similar dip on October 11 preceded a quick rally from $110,810 to $115,321 (a 4% rise) within two days. This setup suggests that Bitcoin could once again be entering an accumulation phase before a breakout.
Combined, these two on-chain signals show that investor confidence and profitability are recovering, even though sentiment remains cautious.
Bitcoin Price Chart Pattern Hints at a Breakout If $114,000+ Gives Way
On the daily chart, Bitcoin is trading within a falling wedge, a bullish reversal pattern that often precedes upward movement. The structure shows both trendlines converging downward, but with volume steadily declining, confirming the wedge’s validity.
This setup usually ends with a breakout above the upper trendline, supported by increasing volume and renewed buying pressure. At the time of writing, BTC trades near $111,346, having flipped $108,918, a key resistance, into support.
The next major level to watch is $112,242, which aligns with the upper boundary of the wedge. A daily close above $114,928 (zone that has capped previous recovery attempts) would confirm a breakout.
And it would likely open the path toward $117,615 and $121,440, which are 5.6% and 9% above current levels, respectively.
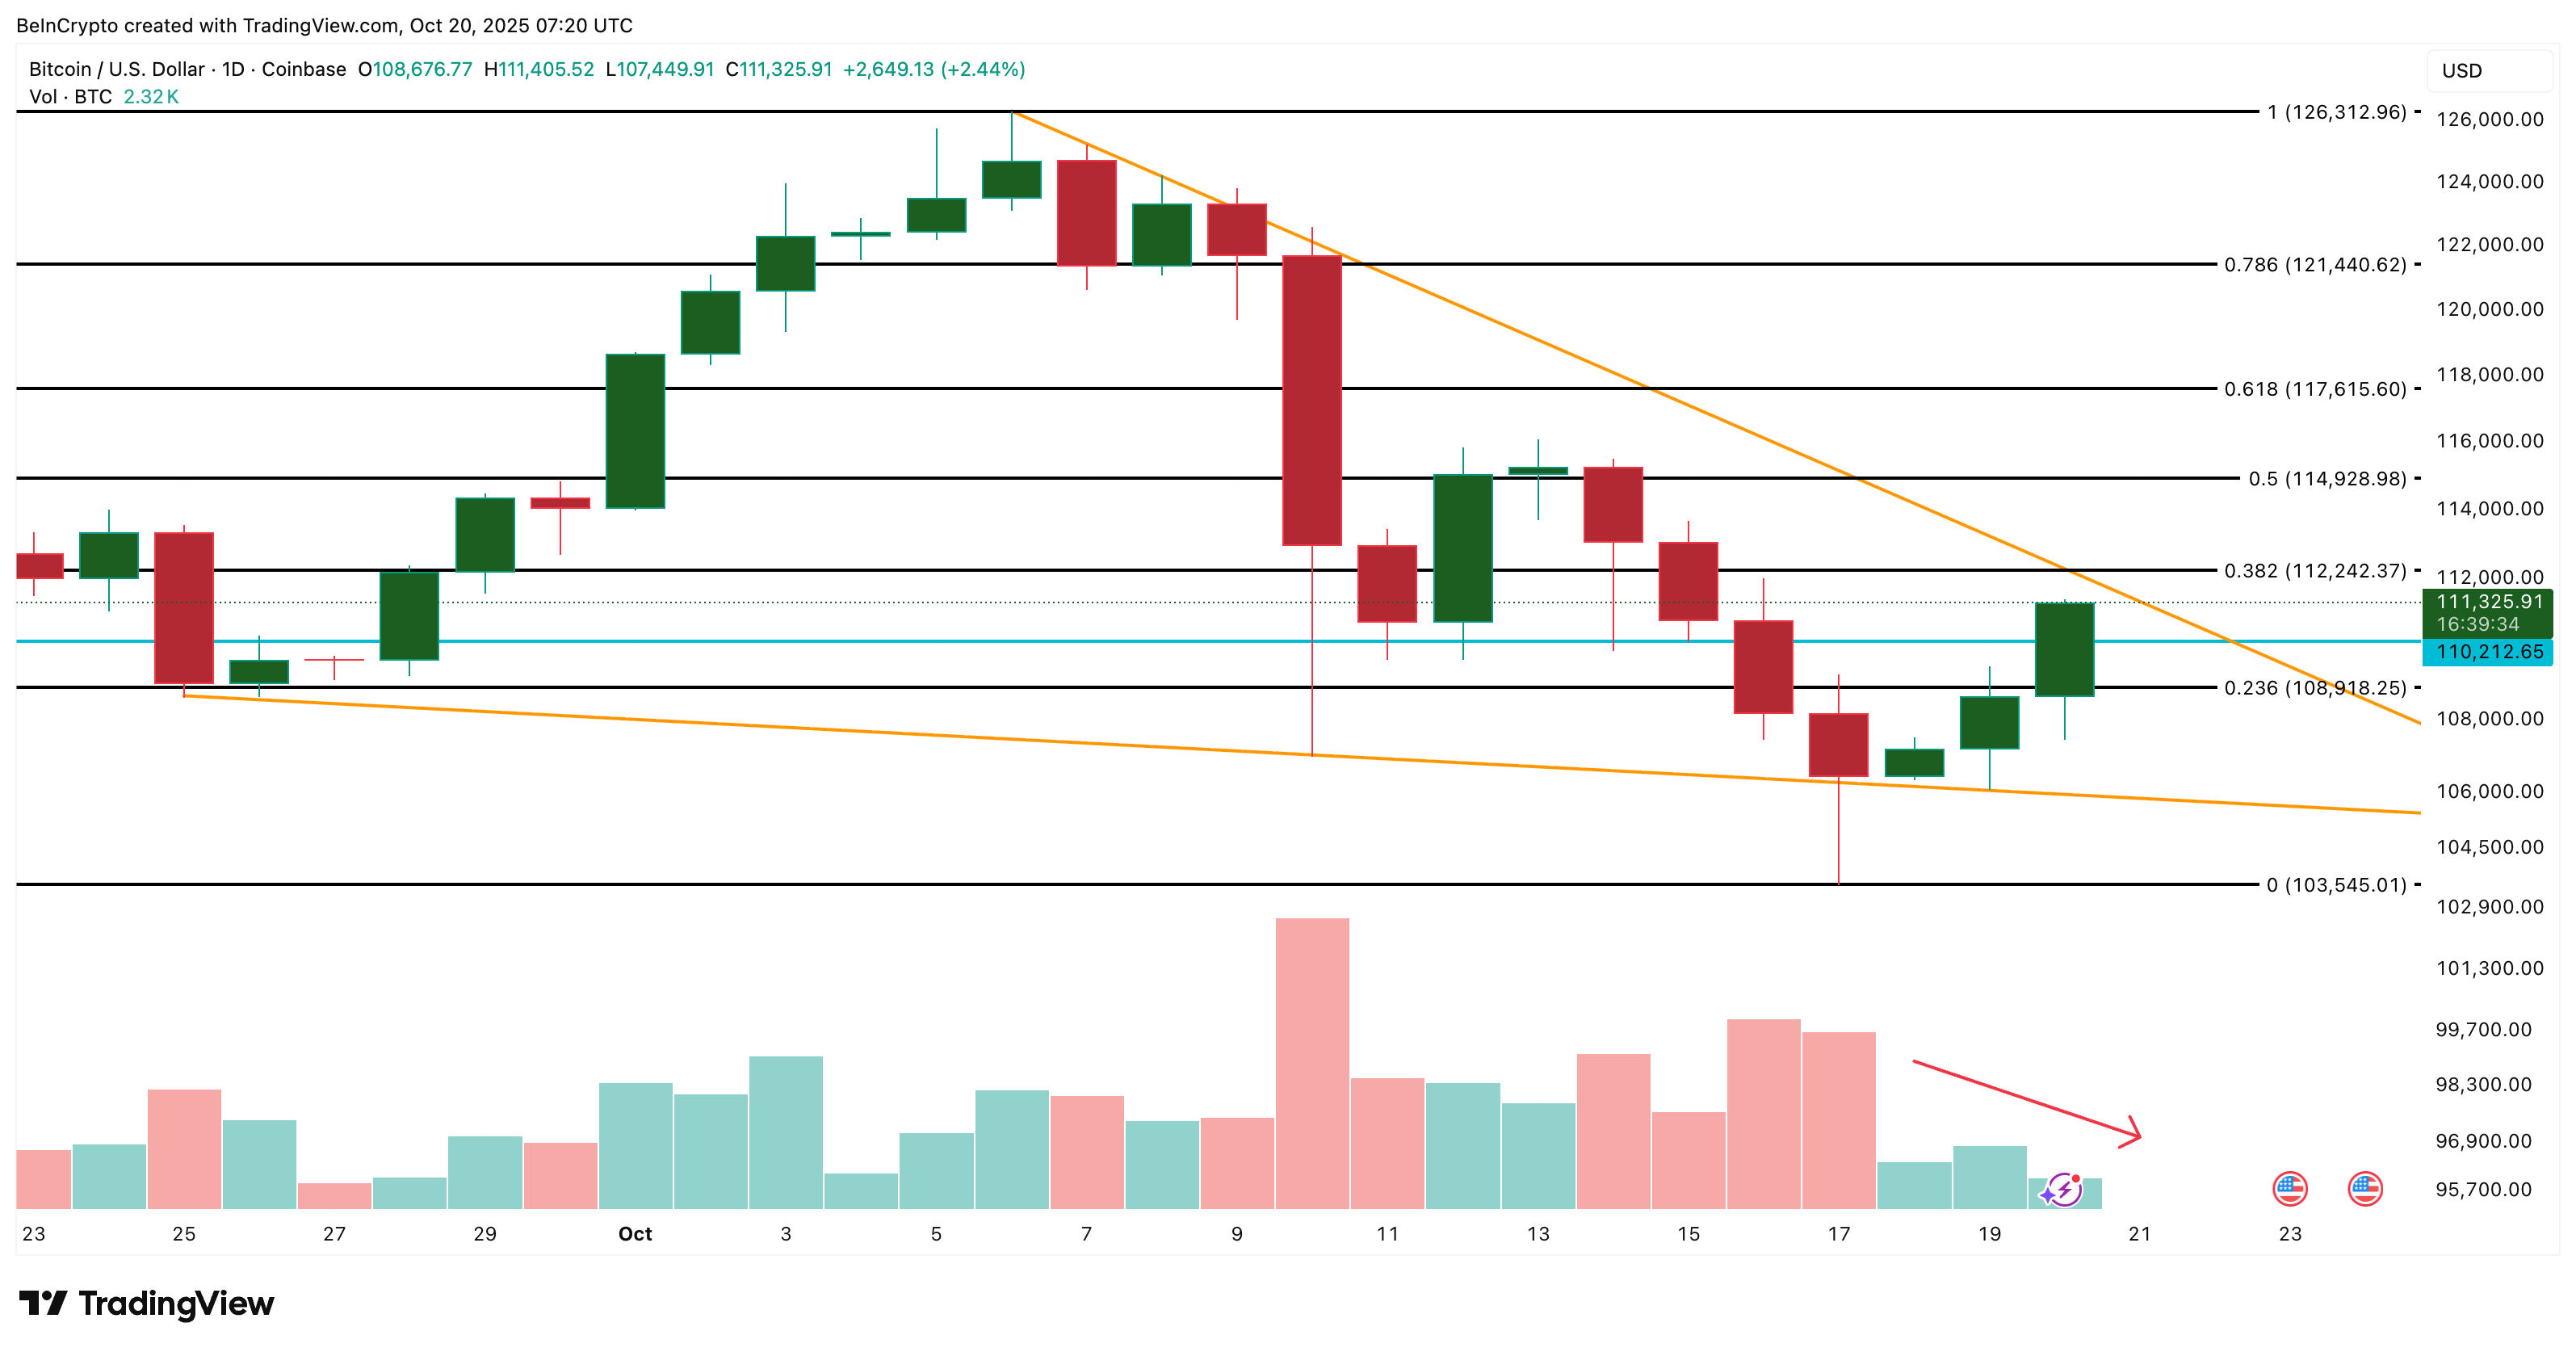 Bitcoin Price Analysis:
If BTC fails to hold $108,918, however, the short-term bullish bias would weaken, with potential downside targets at $103,545 – the lower boundary of the wedge.
Disclaimer: The content of this article solely reflects the author's opinion and does not represent the platform in any capacity. This article is not intended to serve as a reference for making investment decisions.
You may also like
The "debt black hole" behind the AI boom: $1.2 trillion external financing may be needed in the next five years
The rapid surge of AI is creating an unprecedented "debt black hole": according to Bank of America estimates, total capital expenditure for building AI data centers between 2025 and 2030 will reach as much as $5 trillion, with external financing needs of core cloud giants alone reaching $1.2 trillion to $1.5 trillion. Free cash flow is already running low for giants such as Amazon and Meta, while Nvidia and Broadcom have quietly taken on the role of "implicit guarantors"—marking the beginning of a capital gamble that is set to reshape global credit markets.
Analyst Makes Bold Prediction: Micron (MU.US) Expected to Surpass Microsoft (MSFT.US) in Fiscal Year 2027 Profit; Memory Prices Are the Key Factor
Is Micron (MU.US) expected to earn a net profit of $35 billion in a quarter, surpassing Microsoft's (MSFT.US) profits?
Warning Signs of US Stock Market Crash Reappear as in 2018 and 2022? Fed Tightening and US Treasury Supply Hit Amid Worsening Market Breadth, Liquidity Crisis May Be Approaching
Liquidity pressures may not yet be apparent on the surface of the market, but as market breadth in both stock and bond markets continues to deteriorate, these pressures are steadily accumulating internally.
X Finance Bull highlights $3,300 XRP price model filed with SEC
Crypto prices
More


