

Date: Sun, Oct 12, 2025 | 05:34 AM GMT
The cryptocurrency market has witnessed one of the most unforgettable and painful events on Friday night, with a complete bloodbath following the announcement that President Donald Trump will impose a 100% tariff on goods from China — sending panic waves through global financial markets.
This move triggered the largest crypto liquidation in history, wiping out more than $19 billion in just 24 hours and shaking investor confidence across the sector.
SEI crashed to a new all-time low of $0.07989, before rebounding to around $0.2065. Interestingly, this rebound came exactly from a key support level, which could play a decisive role in shaping SEI’s next move.
 Source: Coinmarketcap
Despite the sharp fall, this area of support has so far held firm, suggesting that sellers might be losing steam while early buyers are beginning to accumulate again.
Falling Wedge Pattern in Play
On the weekly chart, SEI appears to be forming a falling wedge pattern — a technical setup that typically signals selling exhaustion and hints at a potential bullish reversal.
The recent sell-off pushed SEI to the wedge’s lower boundary near $0.0849, which has acted as a crucial bottom. From there, the token has managed to bounce back toward $0.2065, showing early attempts by bulls to defend the zone.
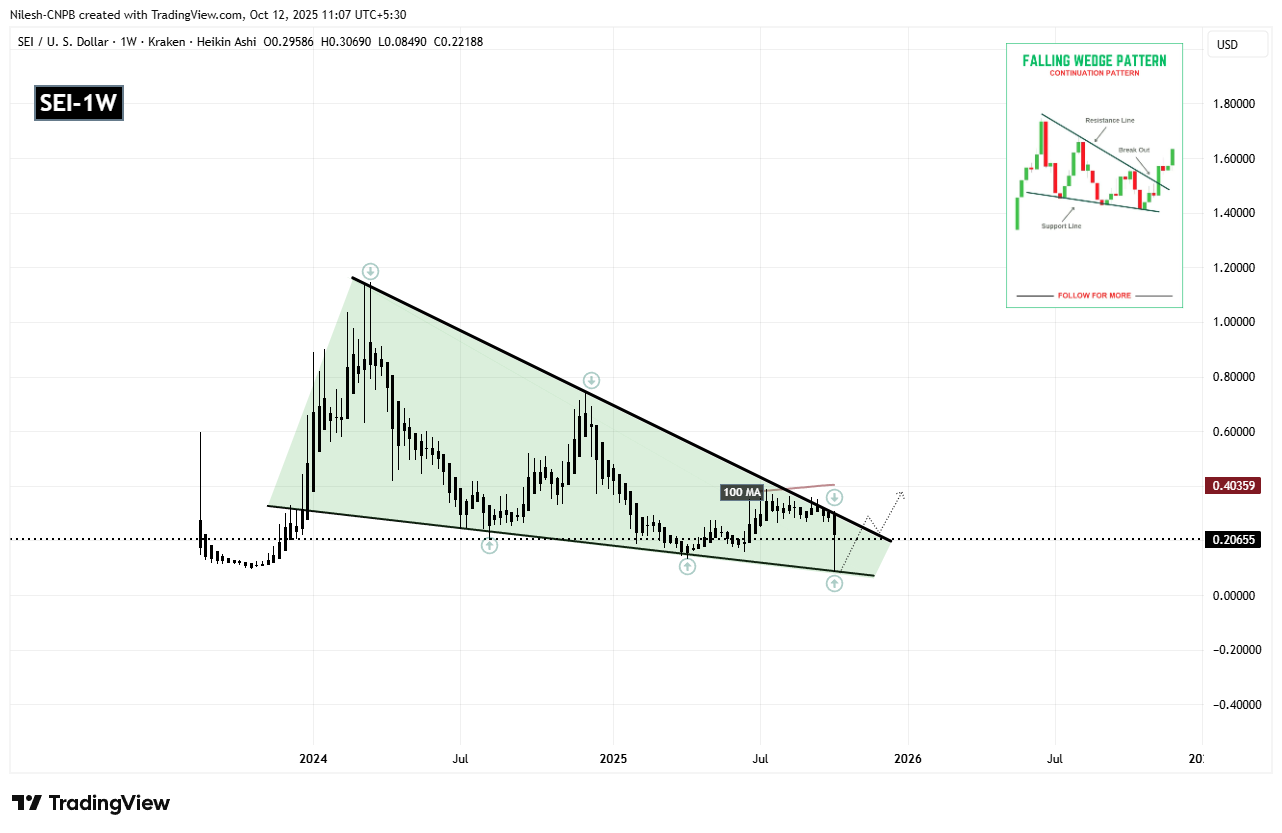 Sei (SEI) Weekly Chart/Coinsprobe (Source: Tradingview)
However, it’s worth noting that bearish pressure hasn’t completely disappeared, meaning SEI could still trade sideways for a while before a major breakout attempt.
What’s Next for SEI?
SEI is now showing early signs of a reversal, but before a clear breakout, it may consolidate within its current narrow range as traders reassess market conditions.
If buying momentum builds from the wedge’s lower boundary, SEI could break above the upper resistance trendline, potentially driving the price toward the 100-day moving average (MA) at $0.4015 — a major technical milestone to watch.
A sustained move above this MA would confirm that SEI has regained bullish momentum and could mark the beginning of a broader recovery phase following the market-wide crash.


