

Date: Thu, Oct 09, 2025 | 04:10 AM GMT
The cryptocurrency market is experiencing a moment of calm after an impressive rally that recently sent Bitcoin (BTC) to a new all-time high of $126,000 before correcting to around $122,000. Meanwhile, Ethereum (ETH) is trading flat near $4,450, reflecting mixed sentiment across the broader market.
Among the altcoins showing some volatility today is Aster (ASTER), which has declined by 4%. Yet, beyond the short-term dip, But what’s catching attention is not just the decline itself — it’s the fact that the token is now testing a crucial technical level inside a key chart pattern.
 Source: Coinmarketcap
Symmetrical Triangle in Play
On the 4-hour chart, ASTER has been consolidating within a symmetrical triangle pattern — a formation that often signals a period of indecision before a strong breakout in either direction.
The latest correction has pulled ASTER back toward the triangle’s lower boundary near $1.7690, where buyers seem to be stepping in to defend the structure. At the time of writing, ASTER is trading around $1.84, sitting just above the support trendline and slightly below the 50-hour moving average (MA) at $1.9189, which has acted as a key barrier for the bulls.
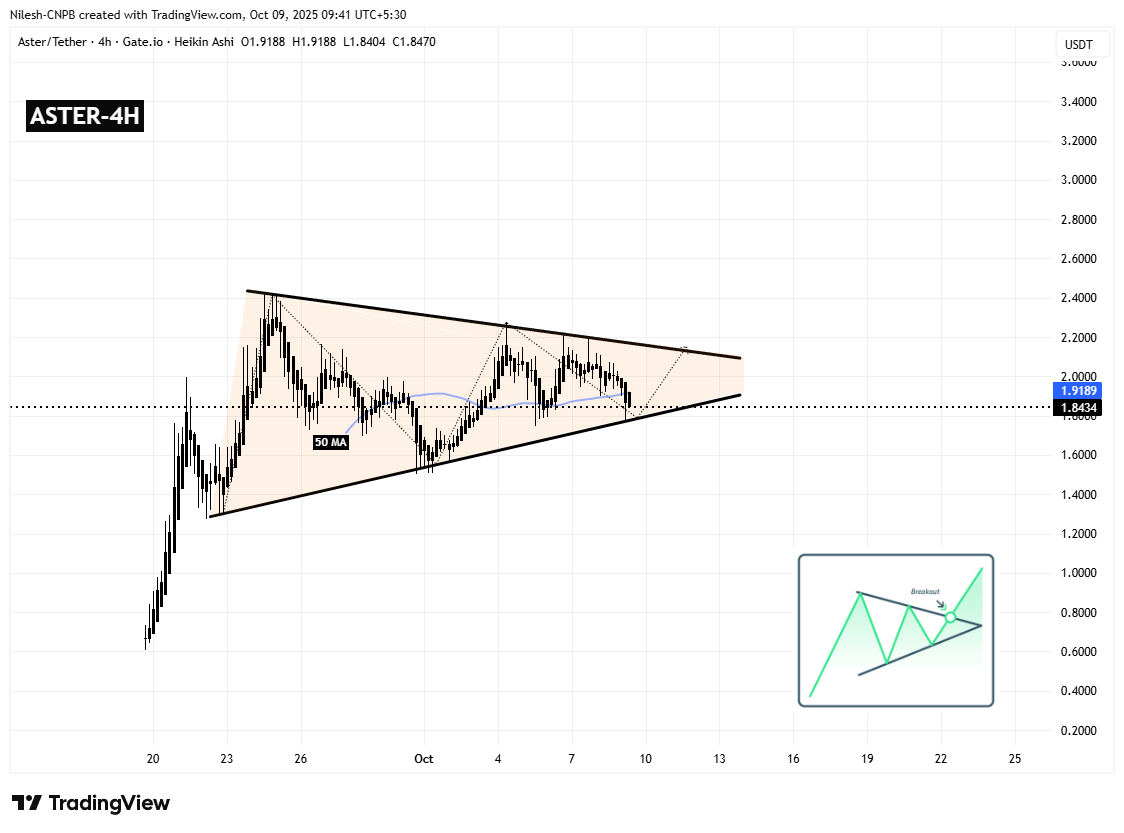 Aster (ASTER) 4H Chart/Coinsprobe (Source: Tradingview)
Reclaiming this MA could be the first signal of renewed momentum, potentially setting the stage for a stronger rebound.
What’s Next for ASTER?
If ASTER successfully holds the ascending support trendline and closes above the 50-hour MA, it could spark renewed momentum toward the triangle’s descending resistance line. A breakout above that level may open the door for a bullish move toward $2.88, which aligns with the measured move target from the pattern’s height.
However, a decisive break below the support trendline would signal a bearish breakdown, potentially pushing the price toward lower supports and delaying any bullish recovery in the short term.
For now, ASTER appears to be at a critical turning point — a level where patient traders are waiting for confirmation of either a bounce or breakdown before the next major move unfolds.


