
BTC Volatility Weekly Review (September 22 - October 6)
Key indicators (4:00 PM HKT on September 22 -> 4:00 PM HKT on October 6): BTC/USD increased by +9....

Key Indicators (4:00 PM HKT, September 22 -> 4:00 PM HKT, October 6)
- BTC/USD up +9.2% ($113,000 -> $123,450)
- ETH/USD up +8.6% ($4,180 -> $4,540)
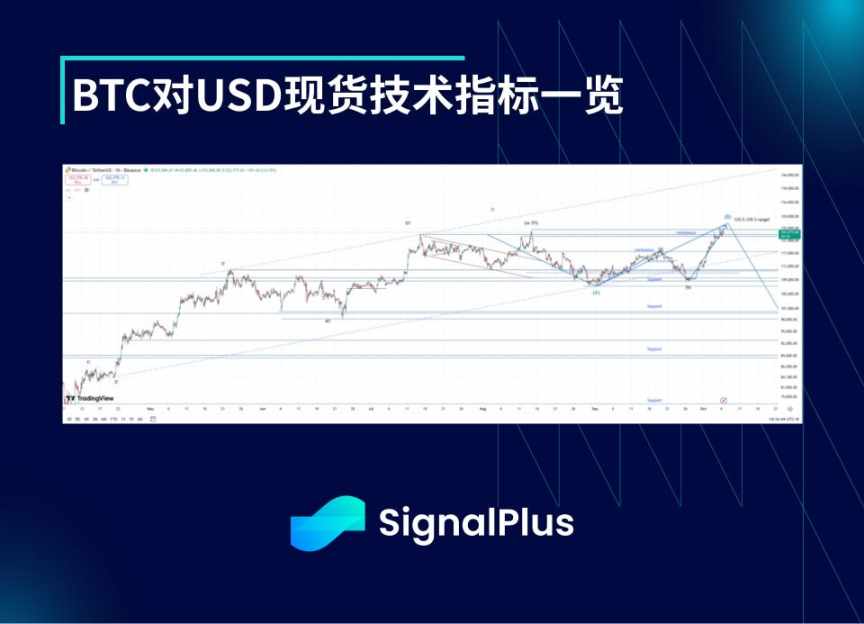
- After dipping to $108,000 in the previous week due to month-end/quarter-end position closing, BTC prices rebounded sharply and quickly this week, reaching new highs. From a technical perspective, the “extension?” plus sideways adjustment we have been expecting seems to have begun. Given that price action is generally in line with our long-term level expectations, we continue to believe that a sideways adjustment is the most likely price movement. Therefore, we expect a high to form near $129,000-$130,000; if this range is broken, we will need to reassess this move, as it may signal the start of the next gradual upward trend. We expect the initial strong support during a pullback to be at $120,000-$118,000, but any move below this range could mean entering the anticipated sharp C-wave downward adjustment (below $100,000).
Market Themes
- The past two weeks have seen quite a lot happening in the cryptocurrency market. Month-end/quarter-end position closing flows pushed BTC down to a low of around $108,000, ETH briefly fell below $3,900, and SOL plunged to $190 after losing the $250 level. However, as soon as “Golden October” began, market sentiment quickly reversed, and prices rebounded rapidly to previous highs of $117,800-$118,000 (where the coin price found solid support after both the Jackson Hole meeting and the FOMC meeting), triggering some short covering and ultimately leading BTC to test and break through its all-time high, briefly standing above $125,000. This rally is largely attributed to the “catch-up” with gold prices, which have been hitting new highs daily. The main drivers are the U.S. government shutdown and heightened concerns about persistent inflation (especially as most G10 central banks are cutting rates). The stock market also shook off the pressure from month-end position closing, and optimism around AI and data center investment continues to ferment.
BTC/USD Implied Volatility
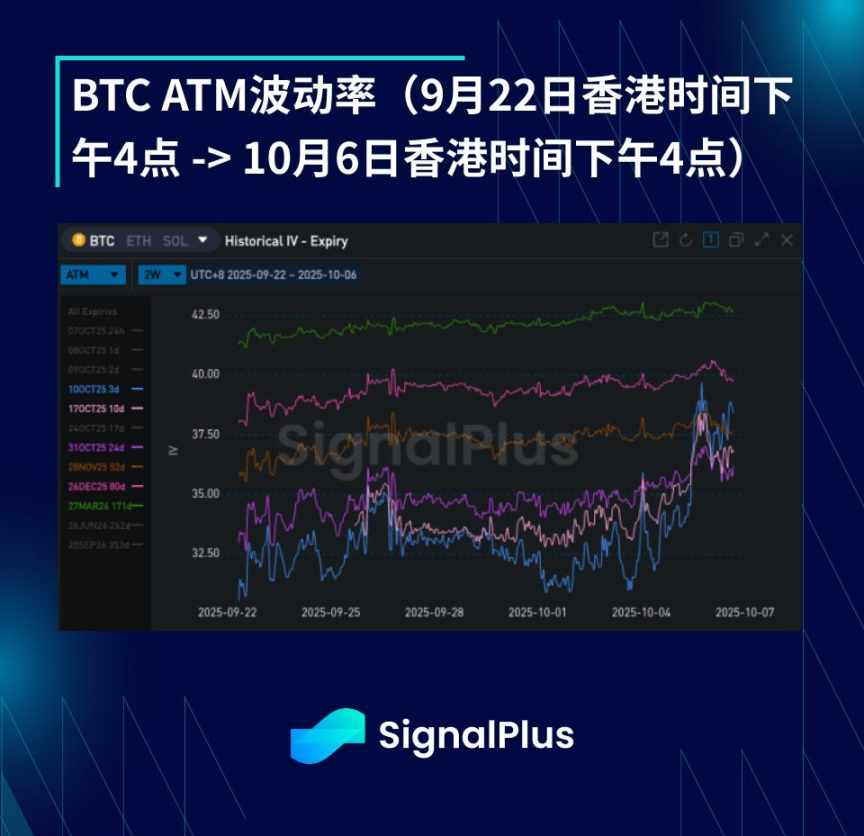
- Despite a wide price range over the past two weeks, with moves from $113,000 -> $108,000 -> $125,000, high-frequency realized volatility was quite moderate, staying within the 25–35 point range. Ultimately, we did not see any price gaps, as spot liquidity remains sufficient within this range, and the market seems to be locally holding long Gamma positions, mainly due to persistent Gamma selling pressure in recent weeks, which also helps suppress local volatility.
- The lackluster realized volatility offset the risk premium rebound we expected during price rises and range breakouts, causing the 1-month and longer-term implied volatility curves to remain largely static. Due to unexpected weekend moves, short-term implied volatility rose significantly, but given that spot prices have now found balance around $123,000-$124,000 and realized volatility remains moderate, we can expect implied volatility for these terms to quickly retrace lower. With the U.S. government shutdown, risks related to non-farm payroll and CPI data remain “pending” due to uncertainty over their release dates. Considering the inverted volatility curve, we prefer to hold contracts expiring on October 31 to hedge against these data and FOMC meeting risks.
BTC/USD Skew / Kurtosis
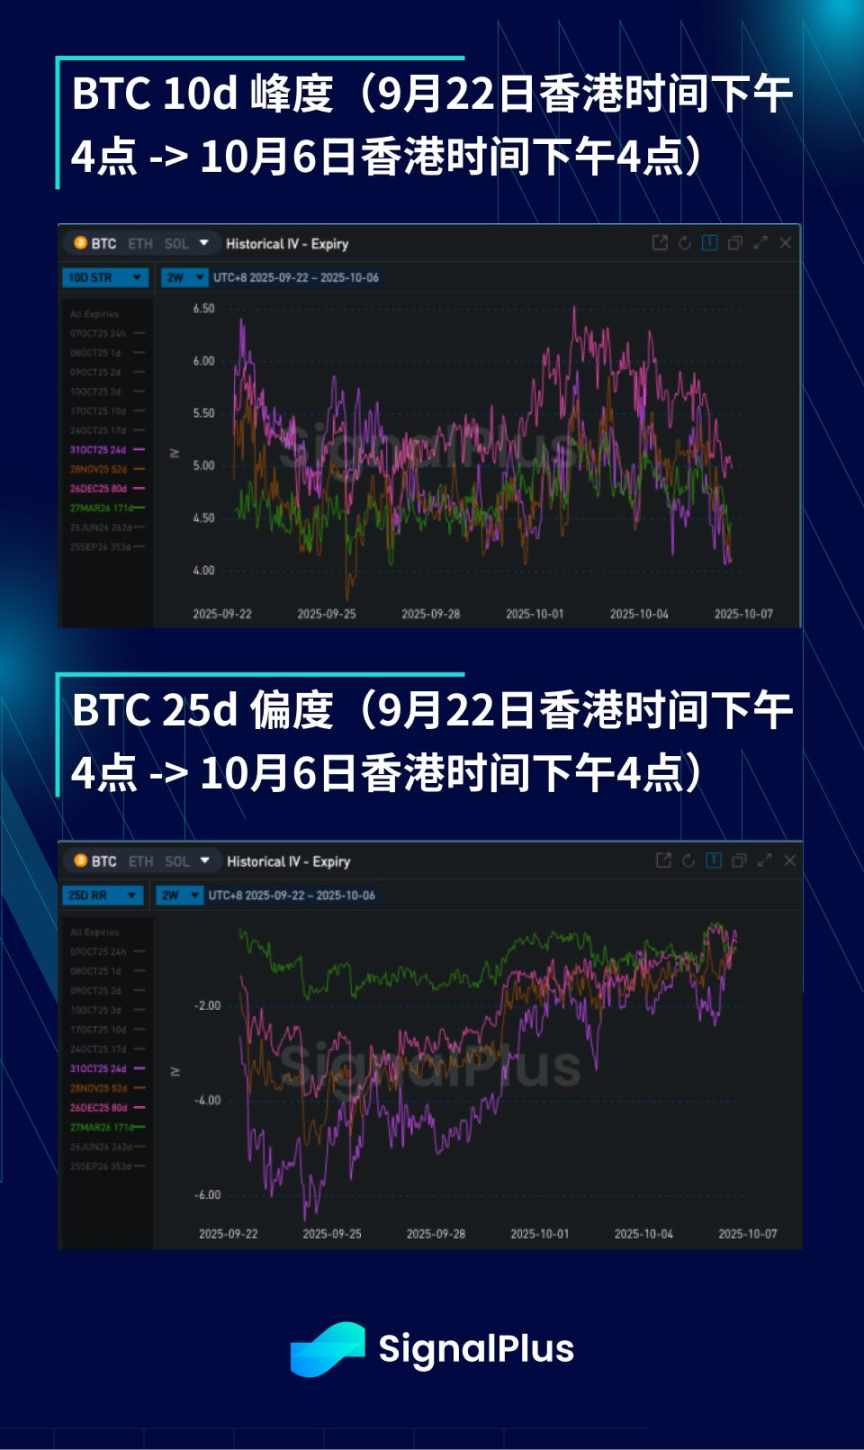
- Skew has retraced from deeply bearish levels over the past two weeks, as spot buying resumed after month-end/quarter-end position closing, and market concerns about a sharp drop below $100,000 quickly eased. Although realized volatility on the upside has not been high, there has been some demand for call options in the market, and there is also recognition that upward momentum could extend to “interesting” levels, potentially increasing volatility. In contrast, it is clear that the “riskier” side of this asset is to the downside. As funding rates rise and leverage starts to accumulate, the market remains vigilant about downside liquidations, so we have not yet seen skew enter bullish territory (except for ultra-short-term contracts).
- Kurtosis began to decline last weekend, as demand for call option spreads led to wing-side selling pressure. In addition, given the current price level, the market may expect new selling pressure above, thus suppressing implied volatility on the upside. Meanwhile, after the price rise, some opportunistic downside wing selling pressure also emerged. Notably, if the price cleanly breaks through either side of the $115,000-$130,000 range, it could lead to a sharp repricing of skew (e.g., a break above $130,000 would favor call options, while a drop below $115,000 would heavily favor put options), so there is a dynamic adjustment of skew Gamma that suppresses kurtosis levels.
Wishing you a successful trading week ahead!

Disclaimer: The content of this article solely reflects the author's opinion and does not represent the platform in any capacity. This article is not intended to serve as a reference for making investment decisions.
You may also like
How to avoid AI? This is the big dilemma for pension funds and sovereign funds
The AI wave is breaking through institutional investors' diversification defenses. From stocks and private equity to bonds and infrastructure, AI risk has fully penetrated—Goldman Sachs estimates that companies related to AI account for 40% of the S&P 500's market value, and AI bond issuances make up nearly half of the investment-grade market. Pension funds and sovereign wealth funds are being forced to redefine "risk," struggling to survive between missing out on gains and excessive concentration.
Weekly U.S. Equities Macro Outlook (Sep 21–Sep 25):
Highlights of the U.S. Stock Market This Week: Intensive Speeches from Federal Reserve Officials, Middle East Situation and China-U.S. Summit Influence the Market
This week, U.S. stock market investors will focus on the trajectory of interest rates, tensions in the Middle East, the U.S.-China summit and technology-related topics, as well as calls to slow down the development of artificial intelligence (AI), while weighing whether major stock indexes can reach new historical highs.
Crypto prices
More


