
Can 3 Bullish Metrics Spark One Big Pi Coin Price Move? The Charts Say Yes

Pi Coin price is flashing three connected bullish signals — a rising ADX, a bullish RSI divergence, and a strong chart pattern — but can it turn them into one big rally?
The Pi Coin price has been riding the broader market rally, climbing close to 15% in the last 7 days; a pace traders haven’t seen in over a month.
August has started with signs of strength, and now, three key technical indicators are pointing in the same bullish direction. When multiple signals line up, the odds of a strong move rise, but only if the follow-through comes.
Rising ADX Shows Pi Coin’s Trend Is Gaining Strength
The Average Directional Index (ADX) measures the strength of a trend, not whether it’s bullish or bearish. A low reading means the market is drifting lower; a rising reading shows momentum is building.
 PI price and rising momentum:
TradingView
PI price and rising momentum:
TradingView
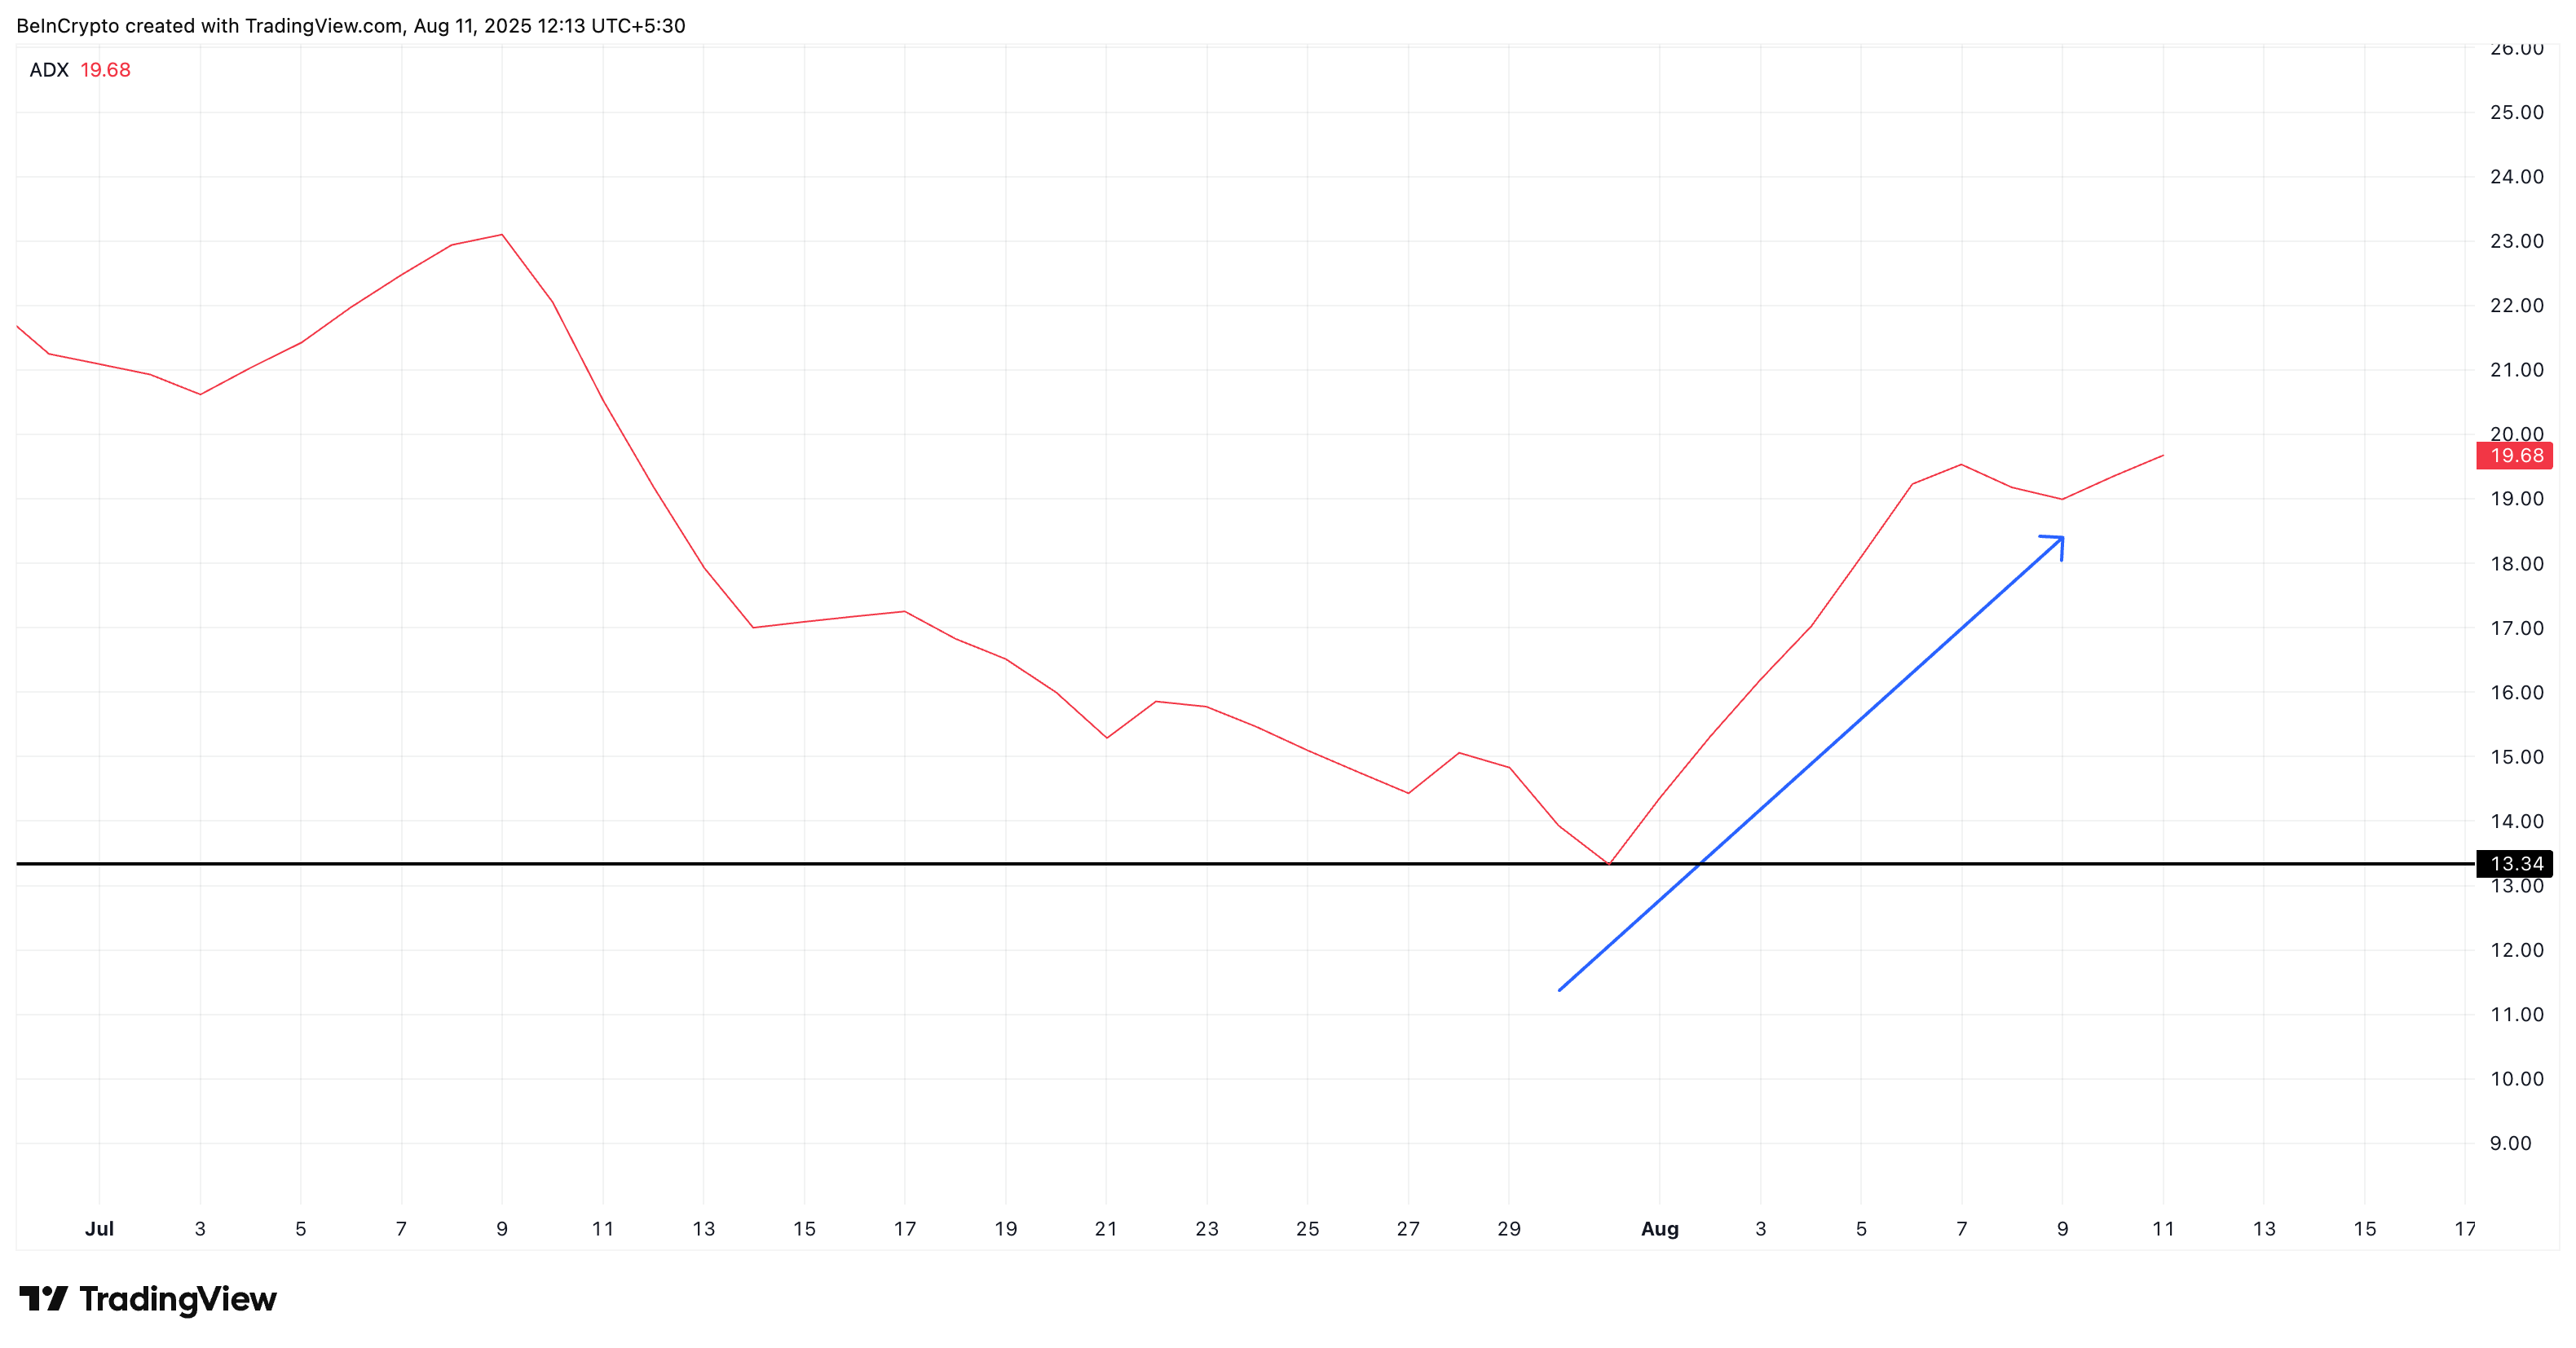
For the Pi Coin price, the ADX was near 13.3 on 31 July, which is considered a weak trend. As of now, it has jumped to 19.6, suggesting the current uptrend is starting to gain real traction.
A strengthening ADX in an upward price trend means buyers are pressing harder, and the market is committing more volume to the move. This makes Pi Coin’s next resistance tests more meaningful.
For token TA and market updates: Want more token insights like this? Sign up for Editor Harsh Notariya’s Daily Crypto Newsletter here.
Daily RSI Bullish Divergence Signals Buyers Are Quietly Building Pressure
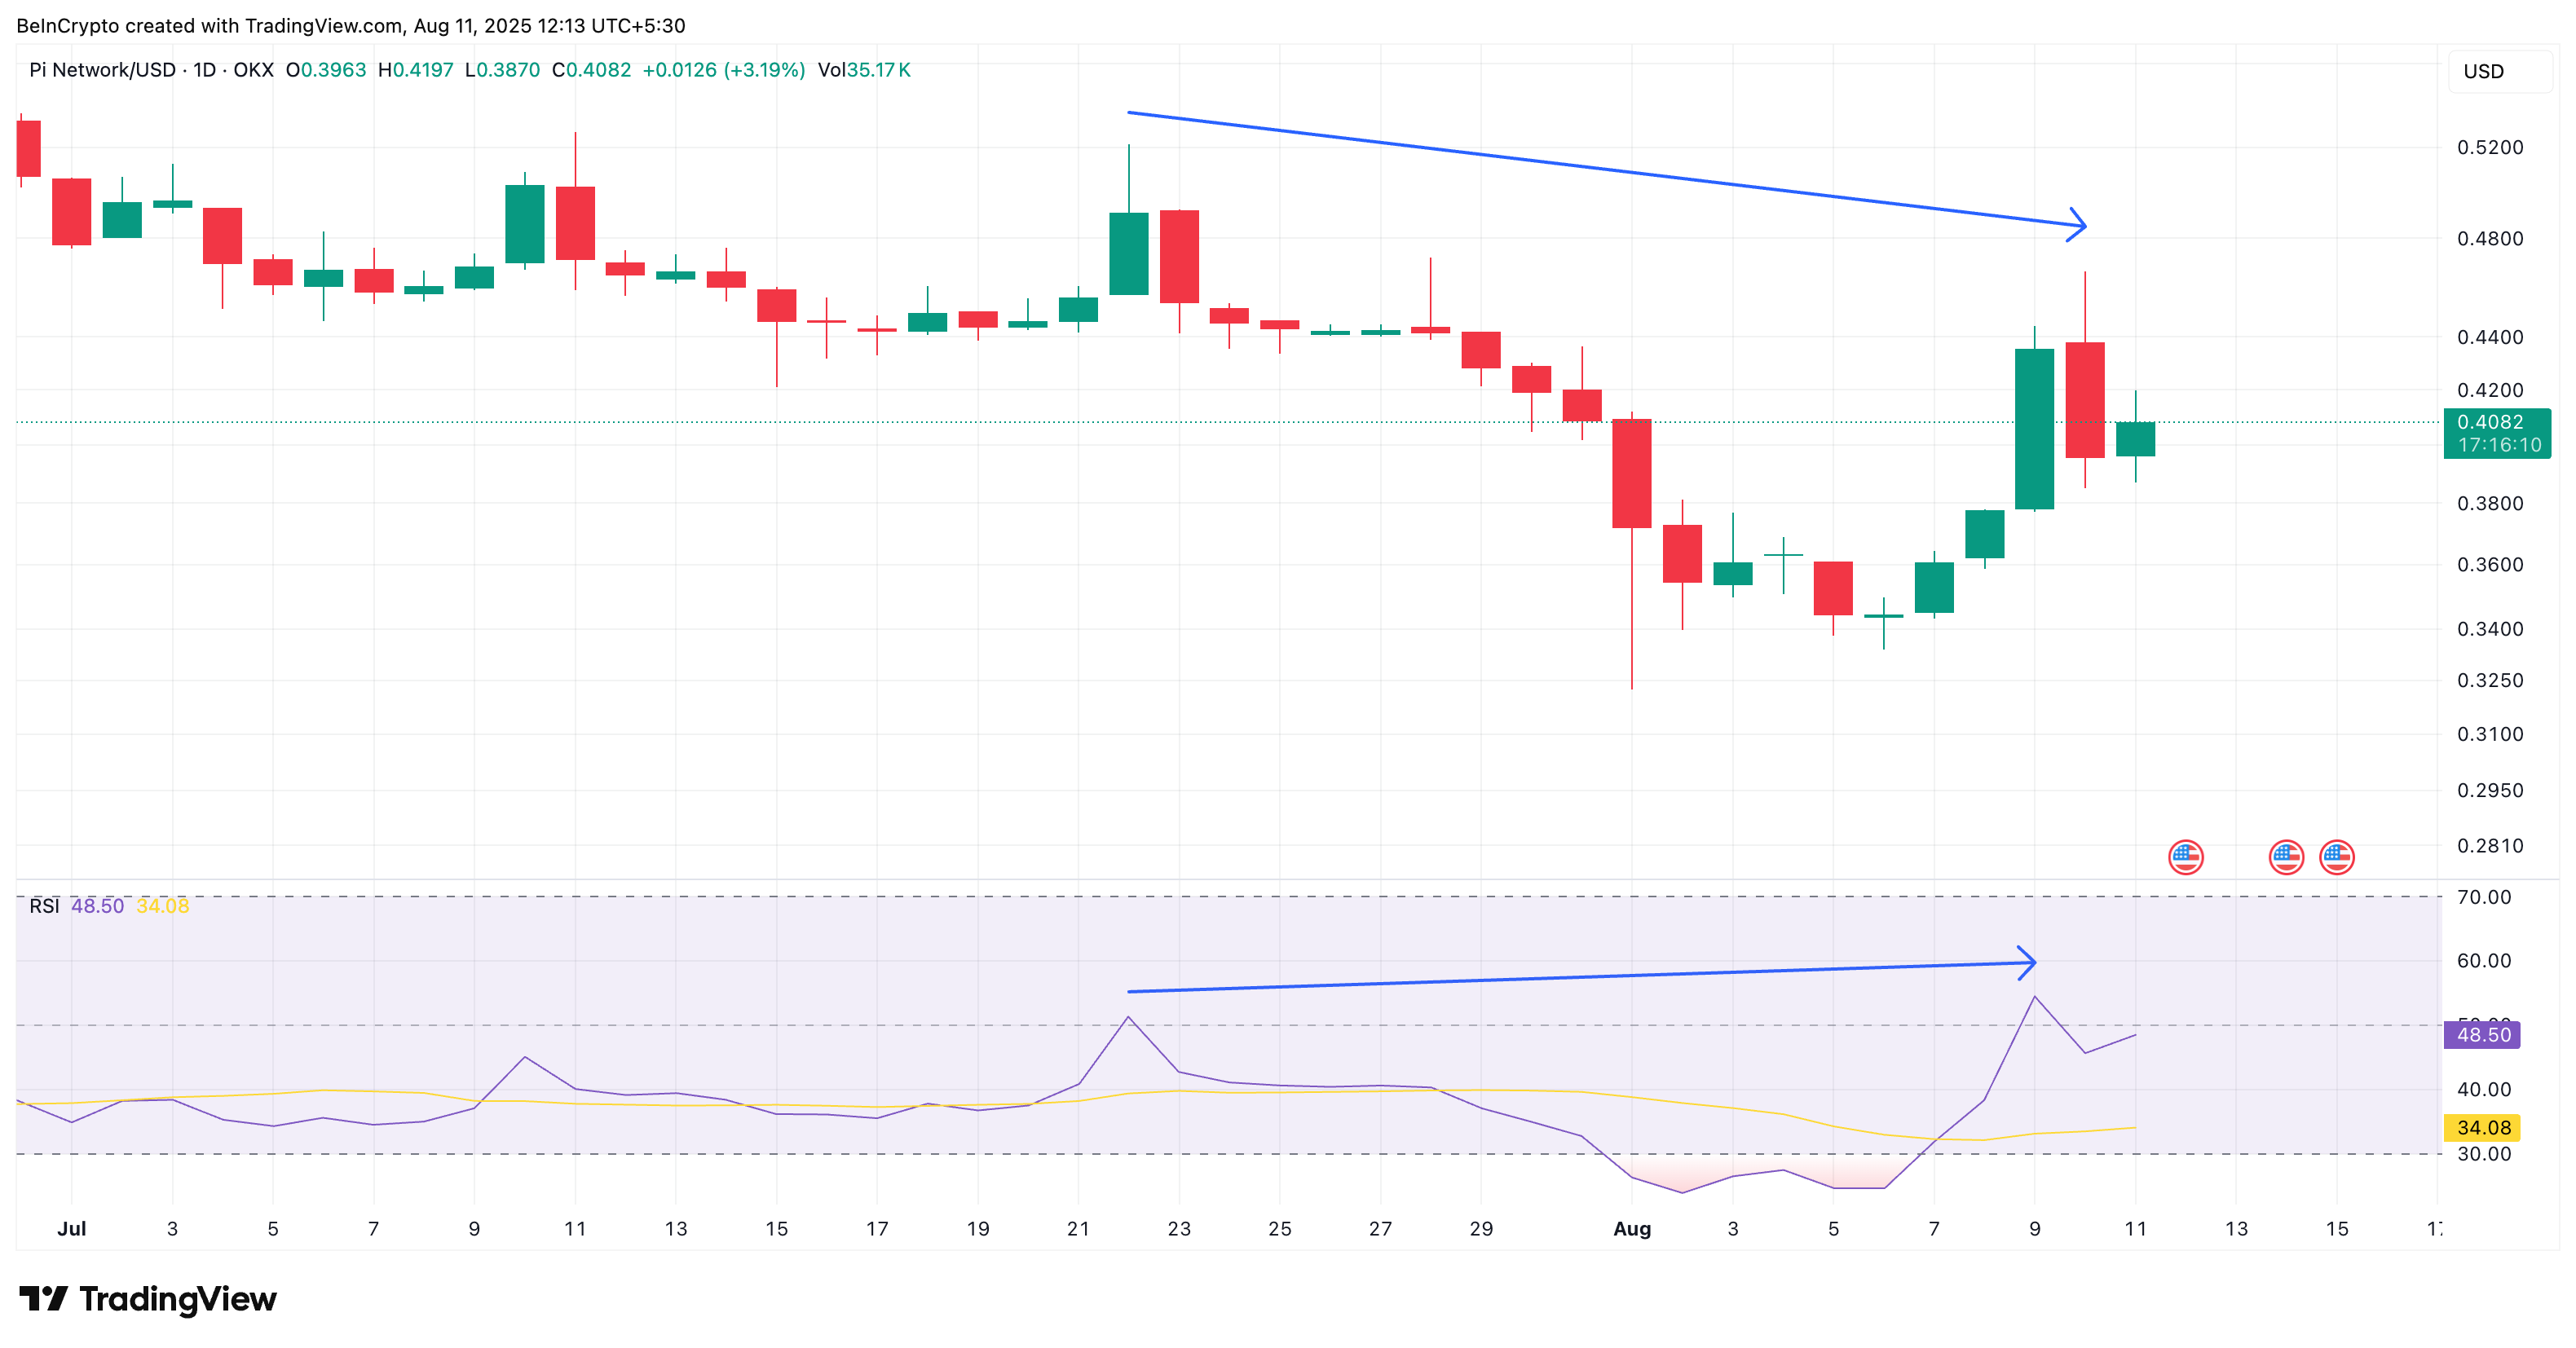
The Relative Strength Index (RSI) measures whether an asset is overbought or oversold by tracking the speed and size of price changes. A bullish divergence occurs when price makes lower highs, but RSI makes higher highs, showing buying pressure is building even as price lags.
 PI Coin price and bullish RSI divergence:
TradingView
PI Coin price and bullish RSI divergence:
TradingView
For Pi Coin, on July 22, the price was around $0.52 with RSI at 51. By August 10, the price had dropped to $0.46, yet RSI climbed to 54. This mismatch shows that sellers are losing control, and buyers are slowly gaining ground. And this is our first bullish metric.
A rising ADX combined with a bullish RSI divergence means the uptrend isn’t just stronger and backed by improving momentum beneath the surface.
4-Hour Chart Keeps Pi Coin Price in a Bullish Structure
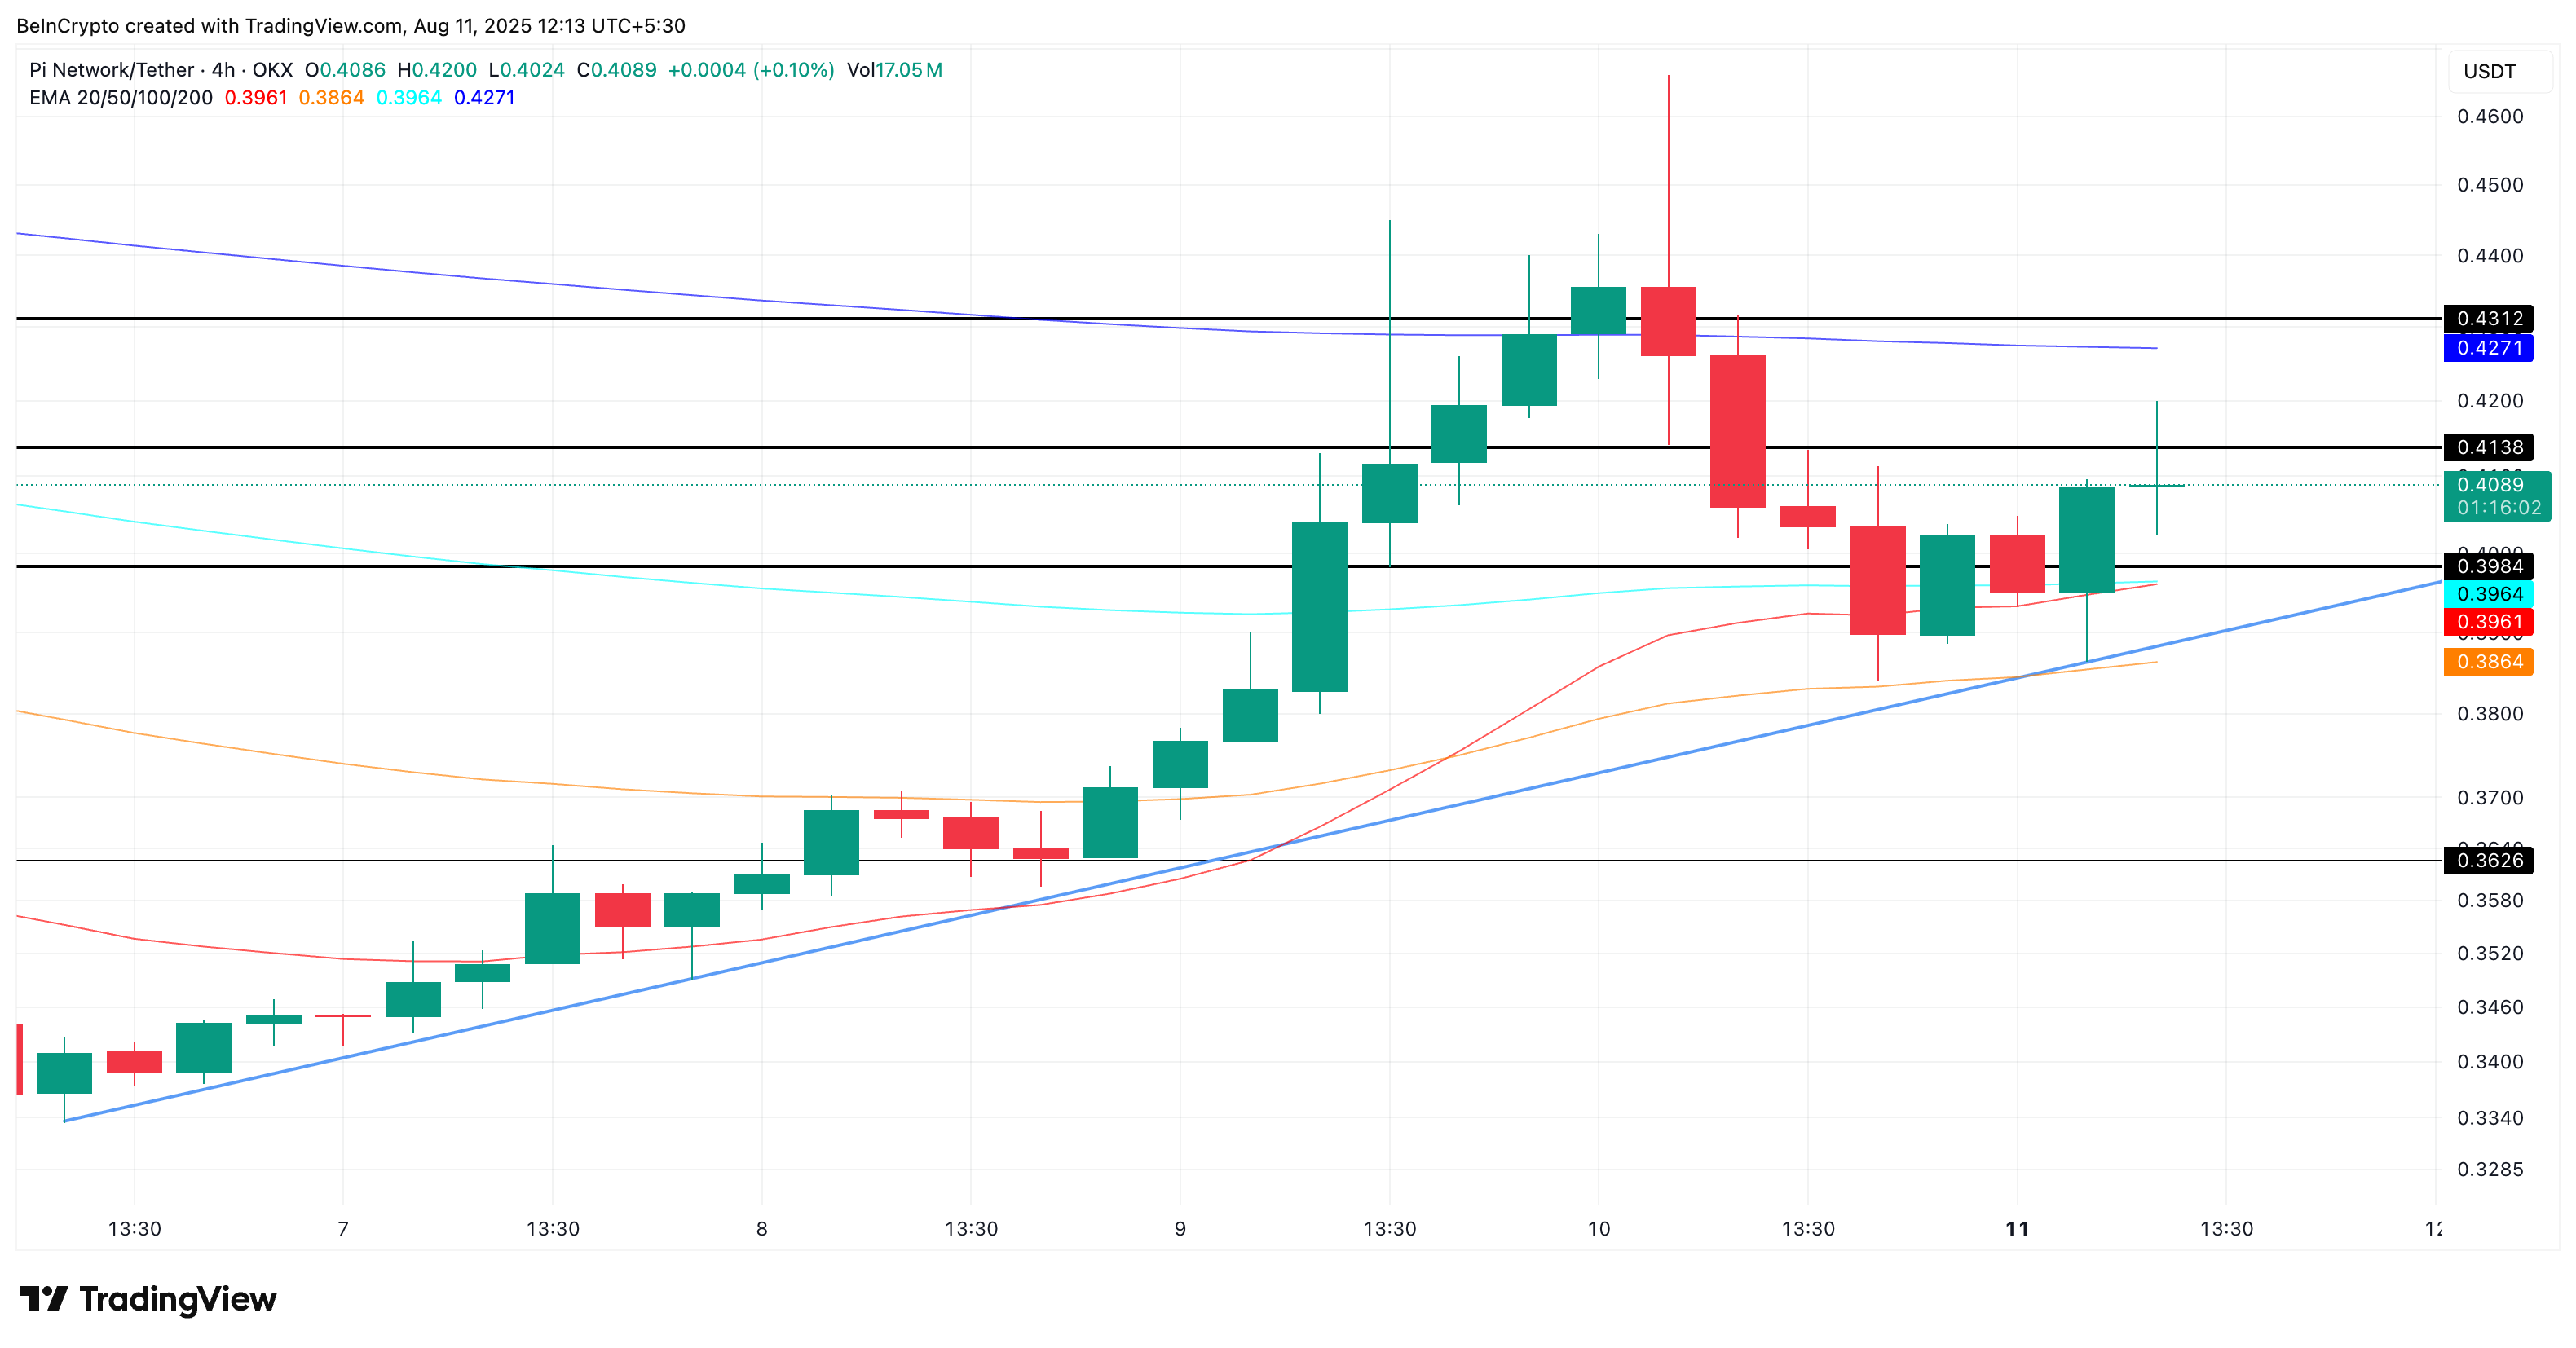
On the 4-hour chart, Pi Coin is holding inside an ascending triangle, a bullish continuation pattern, our second bullish metric. The PI Price remains above the 20-period exponential moving average (EMA) or the red line and 100-period EMA (sky blue), showing short- and mid-term trend strength.
But that’s not all. A bullish “Golden” crossover is almost there, with the 20-period EMA line closing in on the 100-period EMA line. While the lines have touched, all that remains is the crossover to happen. That’s the third bullish metric.
 Pi Coin price analysis:
TradingView
Pi Coin price analysis:
TradingView
Key elements from the chart to watch once the crossover lands:
- Upside breakout: A move above $0.41 and $0.43 could open the door for a sharper rally.
- Support: $0.39 is the first strong floor, followed by the 20-period EMA and 100-period EMA.
- Bearish flip: The structure turns short-term bearish only if the price falls below $0.38 (50 EMA).
If ADX keeps climbing and RSI holds its bullish divergence, a breakout from this pattern becomes more likely, and could fuel the “one big move” traders are watching for. However, a dip under $0.38 invalidates the bullish outlook.
Disclaimer: The content of this article solely reflects the author's opinion and does not represent the platform in any capacity. This article is not intended to serve as a reference for making investment decisions.
You may also like
Morgan Stanley declares that physical AI and space will become the “new electricity” of the economy! Increases holdings of SpaceX (SPCX.US), target price $300
Morgan Stanley has released a research report on physical AI, space, and SpaceX (SPCX.US), stating that robotics and the space industry will reshape the global economic landscape, with their impact comparable to that of electricity in modern economies.

ECB Vice President sounds the "bubble alarm": AI asset valuations are "very high," stock markets are prone to corrections
European Central Bank Vice President Vujičić warns: Asset rallies driven by artificial intelligence are prone to correction risks.

Broadcom (AVGO.US) CEO Responds to "AI Brakes" Theory: AI Semiconductor Revenue Target Remains Unchanged, Aiming for $230 Billion by 2028
Chen Fuyang recently addressed concerns during an interview about the potential impact of slowing frontier AI model development on the chip manufacturer's business, emphasizing that the company remains committed to its long-term revenue targets.

10-year U.S. Treasury yield breaks above 5% to nearly a 20-year high, Fed's anti-inflation credibility faces major test
The yield on the US 10-year Treasury has risen to its highest level in nearly 20 years, marking the latest milestone in the global bond sell-off.

Crypto prices
More


