

Date: Sat, Aug 09, 2025 | 10:54 AM GMT
The cryptocurrency market is in full bullish mode as Ethereum (ETH) broke above the $4,200 level for the first time since 2021. This 8% daily surge has sparked a broad rally, with major memecoins — including Dogwifhat (WIF) — riding the wave higher.
WIF has posted a 5% gain in the last 24 hours, but more importantly, its price chart is now flashing a harmonic pattern that may reveal its next big move.
 Source: Coinmarketcap
Harmonic Pattern Hints at Potential Bounce
On the daily timeframe, WIF is shaping up a Bearish ABCD harmonic pattern — a formation that, despite its “bearish” tag, often includes a bullish CD leg before the price reaches its potential reversal zone (PRZ).
The structure began with a sharp rally from point A around $0.6364 to point B, followed by a retracement to point C near $0.8159, where buying pressure reemerged. Since then, WIF has rebounded and is now trading around $1.00, signaling that the CD leg is fully in progress.
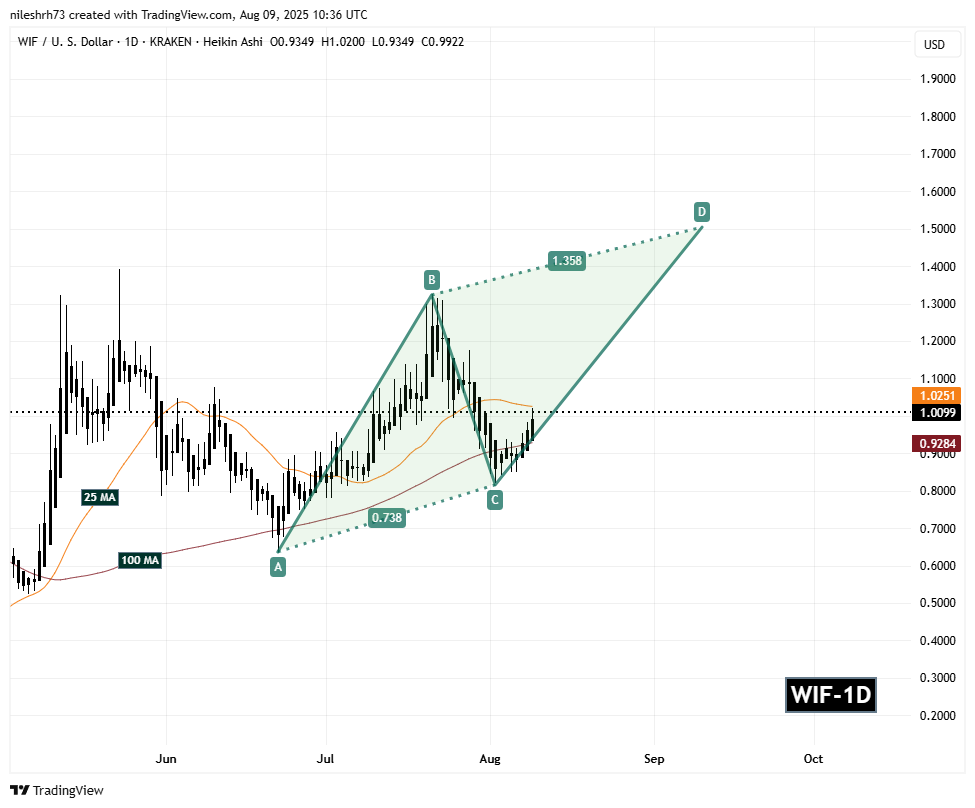 Dogwifhat (WIF) Daily Chart/Coinsprobe (Source: Tradingview)
A push above the 25-day moving average ($1.0251) would further strengthen the bullish outlook and validate the continuation of the pattern.
What’s Next for WIF?
If momentum holds and WIF clears the 25-day MA, the next key target sits near the PRZ at the 1.35 Fibonacci extension of the BC leg — around $1.50. Hitting this level would mark an impressive 48% climb from current prices.
However, the pattern’s bullish trajectory isn’t guaranteed. A failure to break and hold above the 25-day MA could trigger a pullback toward the 100-day moving average at $0.9284, a level that would need to hold to keep the broader uptrend intact.


