Date: Sun, Aug 10, 2025 | 06:40 AM GMT
The cryptocurrency market is in bullish mode as Ethereum (ETH) crosses the $4,200 mark for the first time since 2021. This breakout has fueled a broader rally, lifting several major altcoins — including Kaspa (KAS).
Kaspa has posted an impressive 10% weekly gain. Yet, beyond the price jump, its current chart structure is revealing a familiar pattern that could offer clues about its next move.
 Source: Coinmarketcap
Familiar Pattern Hints at Potential Pullback
On the daily chart, KAS appears to be trading within a descending triangle — a structure that often leans bearish over the longer term. Adding to this caution, a repeating bearish ABCD fractal pattern has formed inside the triangle.
Back in mid-June, KAS was rejected from the “C” point and then broke below the 100-day moving average (MA), triggering a steep 34% decline toward the Potential Reversal Zone (PRZ) and the lower triangle support near $0.060.
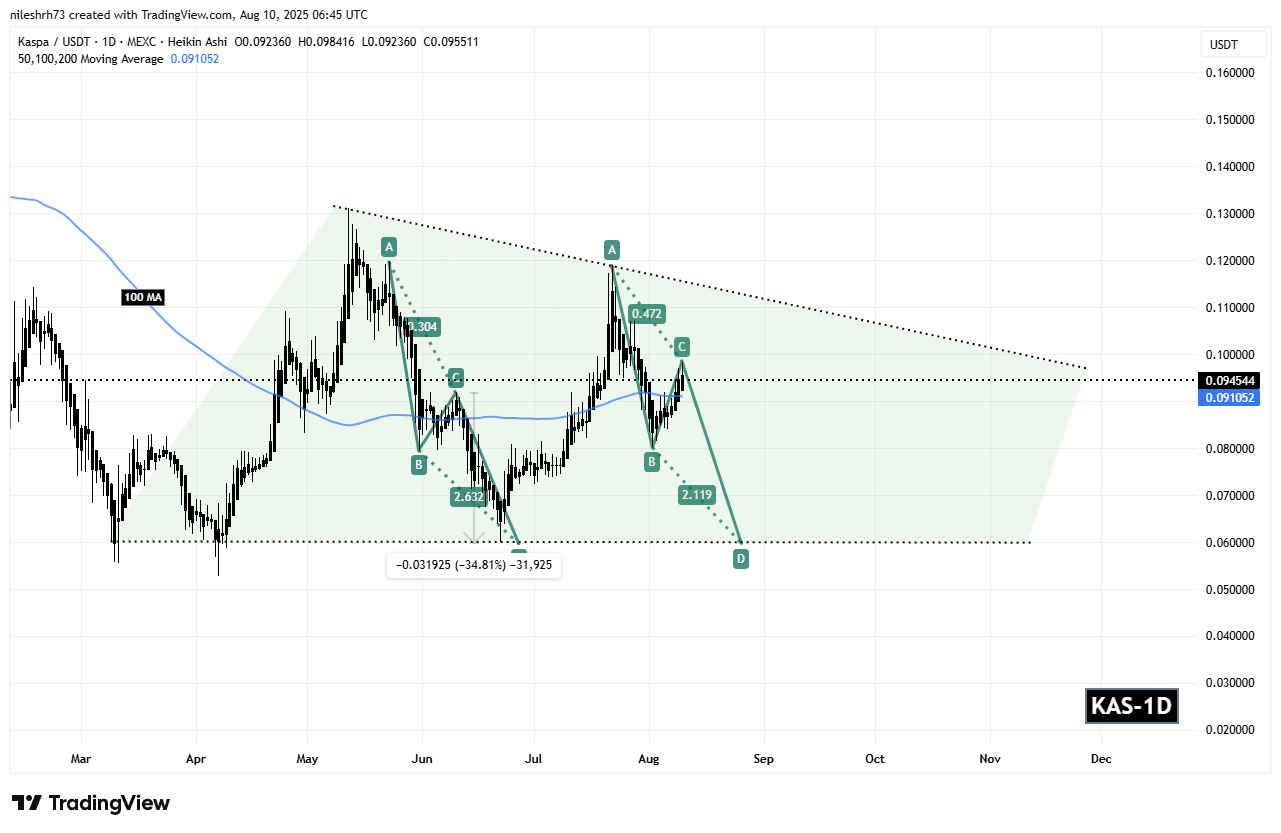 Kaspa (KAS) Daily Chart/Coinsprobe (Source: Tradingview)
Now, history seems to be echoing itself. KAS is once again showing early signs of rejection from the “C” point at $0.0984 and is currently trading near $0.094, just above the critical 100-day MA support at $0.091. This price action is raising the possibility of another leg down if the fractal plays out.
What’s Next for KAS?
If this pattern continues to follow the June scenario, a confirmed breakdown below the 100-day MA could serve as the catalyst for another correction — potentially driving KAS back toward the PRZ and lower triangle support around $0.060, marking a drop of roughly 36% from current levels.
However, the bearish case is not set in stone. If KAS can reclaim and hold above the “C” point at $0.09841, it would invalidate the bearish fractal setup and could open the door for a stronger upward move.