
Ripple Price Analysis: Will XRP Break Above $4 This Week?XRP Price Analysis: Technicals

Ripple has recently rallied to test the key $3.6 resistance zone. Should buying pressure continue and price secure a breakout above this level, the move could pave the way for an extended advance toward the $4 region.
XRP Price Analysis: Technicals
By Shayan
The Daily Chart
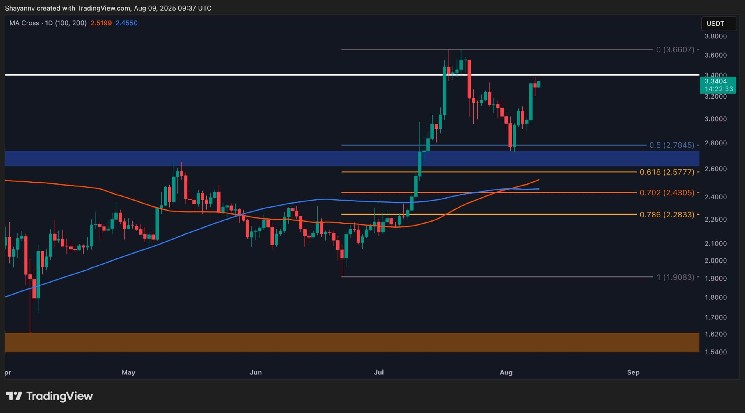
XRP has recently bounced from the critical $2.8 support zone, which aligns with the 0.5 Fibonacci retracement of the prior rally.
This confluence attracted notable buying interest, triggering a sharp upswing toward the $3.4–$3.6 resistance range. This zone represents a prior swing high and a likely area of concentrated supply, making it a significant hurdle for buyers to clear.
If bulls successfully reclaim the $3.6 level with strong volume, the path toward the psychological $4 threshold becomes more attainable. However, given the overhead supply, some short-term consolidation or a minor pullback from $3.6 is possible before any sustained breakout attempt.
The 4-Hour Chart
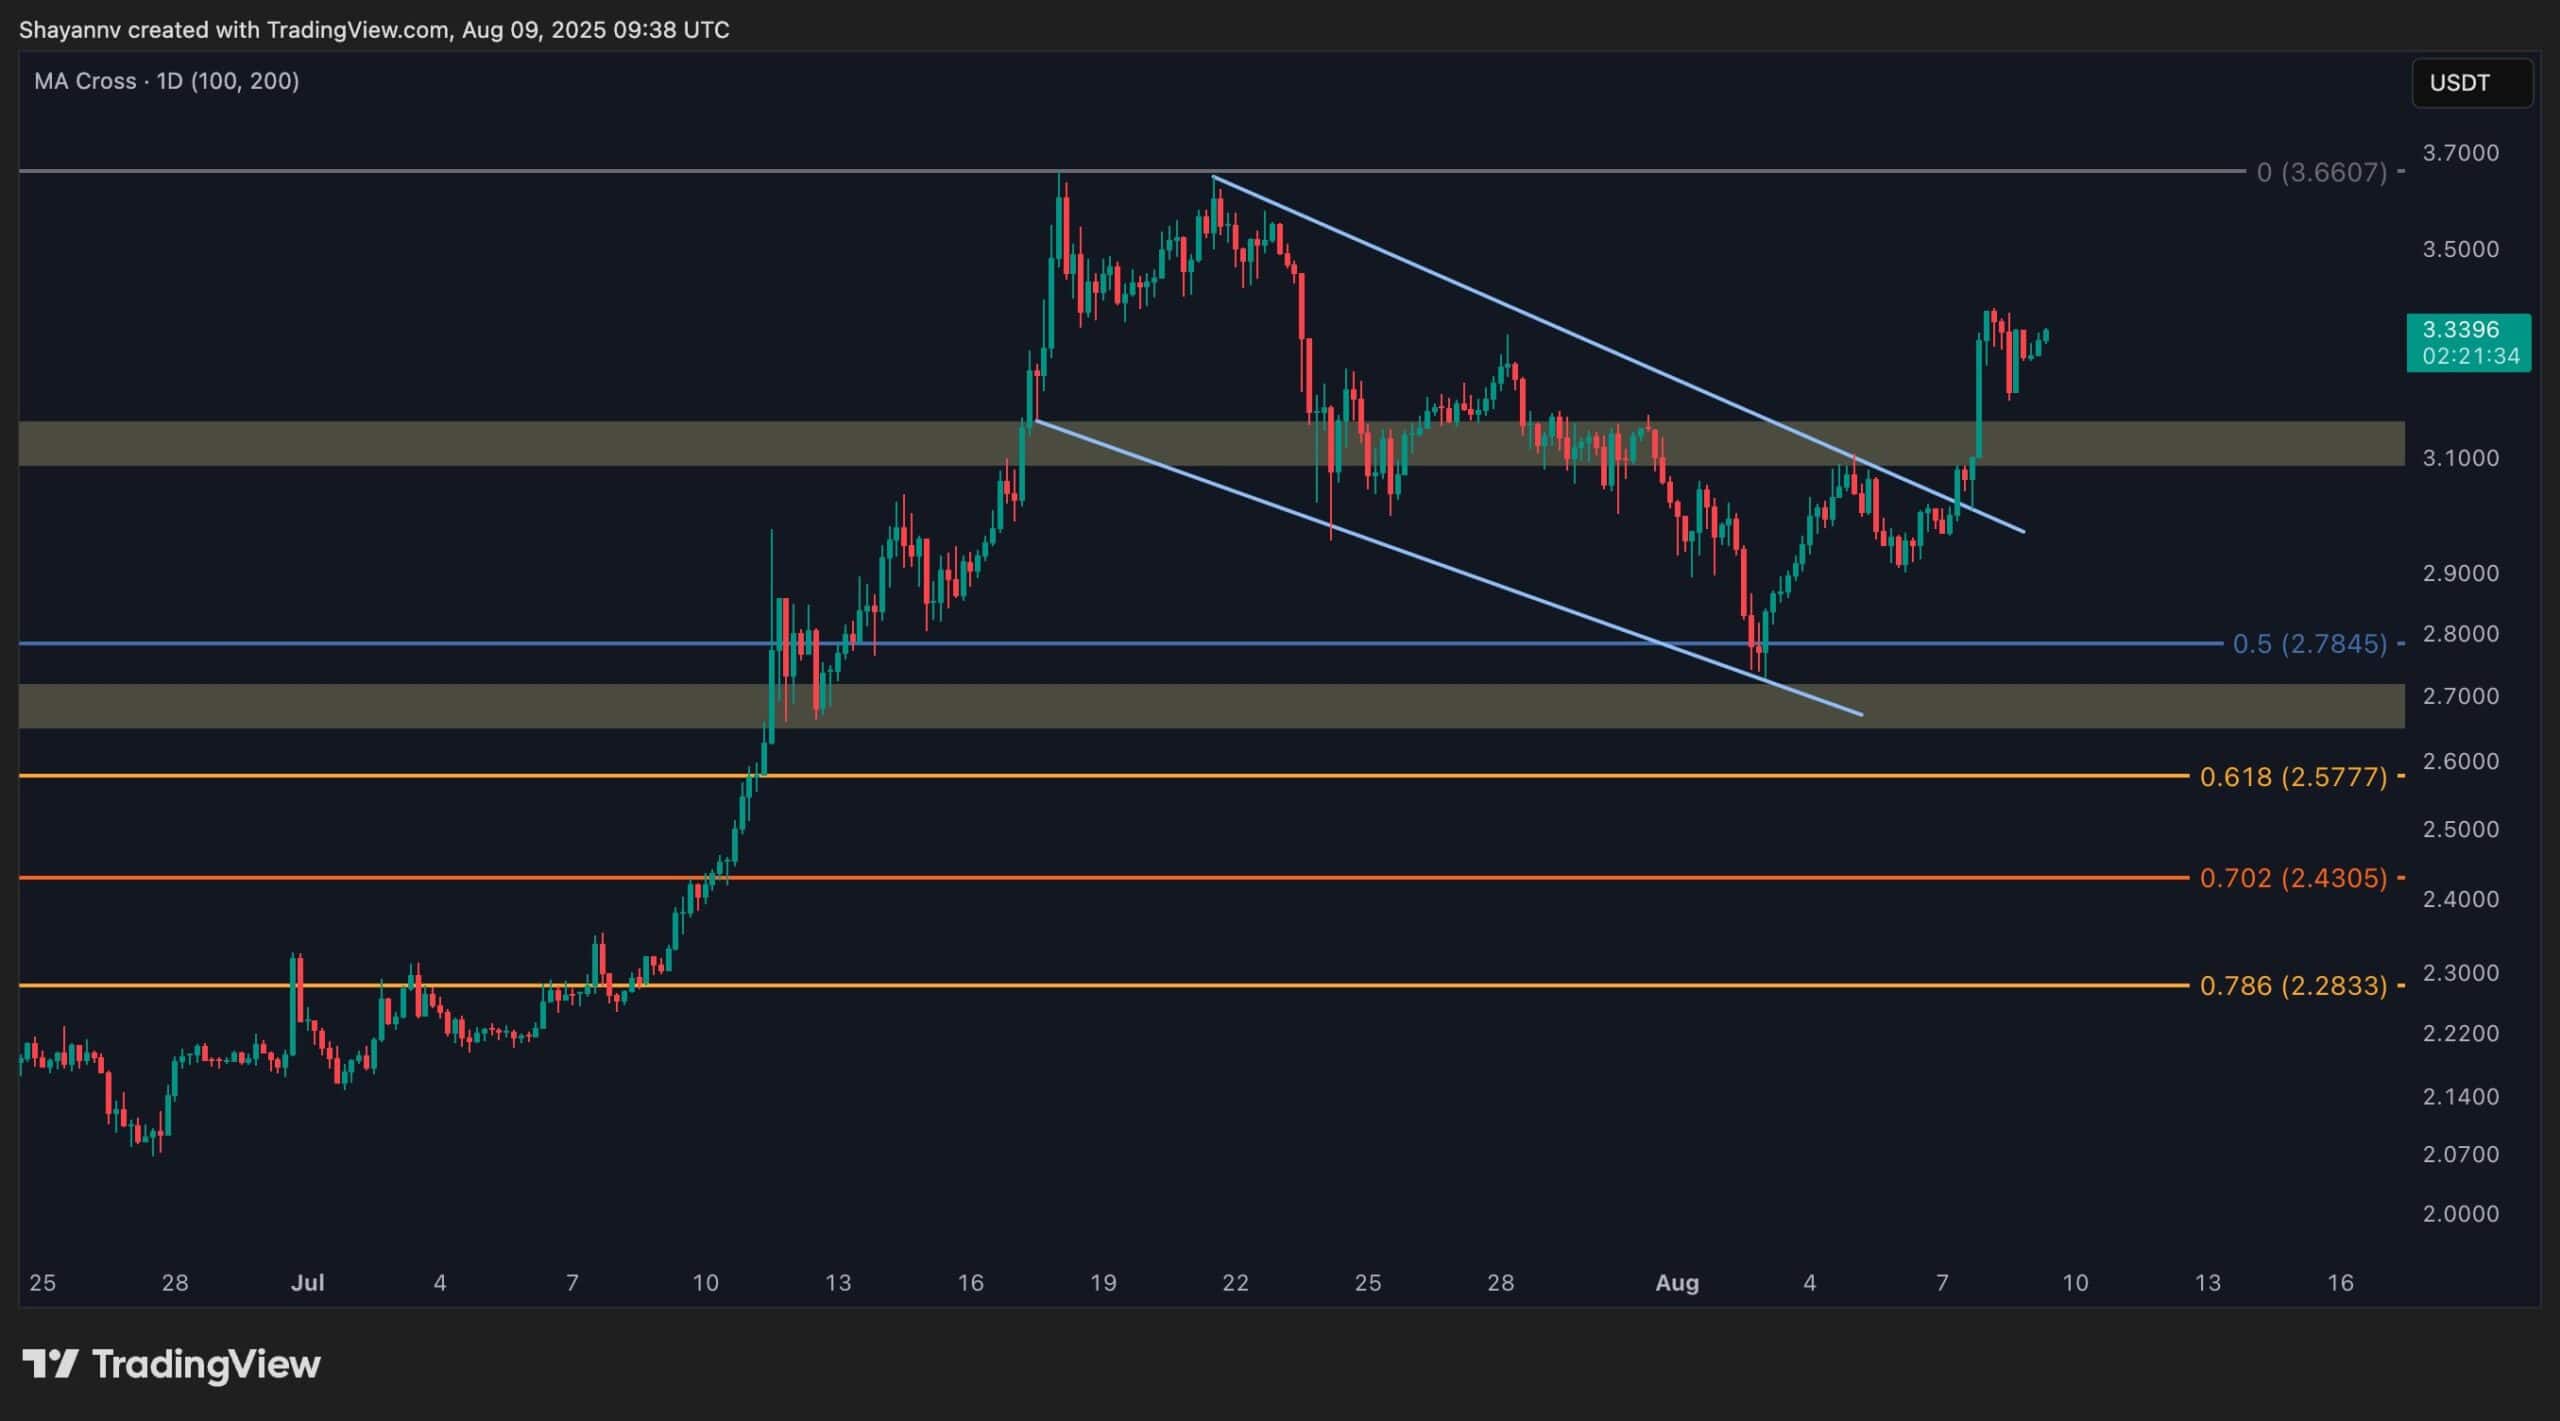
On the 4H timeframe, Ripple’s upward structure is more pronounced. Following a period of consolidation within a bullish flag formation, the market found support at the 0.5 Fib level and broke decisively to the upside. This breakout has fueled the advance toward the $3.6 resistance.
If buyers can overcome this barrier, the resulting breakout could trigger a short-squeeze, accelerating price toward $4.
Conversely, repeated rejections at $3.6 could lead to another consolidation phase within the current range before the next directional move.
Disclaimer: The content of this article solely reflects the author's opinion and does not represent the platform in any capacity. This article is not intended to serve as a reference for making investment decisions.
You may also like
Why Is NEAR Dropping? Open Interest, Funding Rate, and RSI Signal Explained

Why Is UNI Up 4.84% While REZ Drops 15% Today? Here’s What the Data Says

Why Is USELESS Dropping 4.84%? Open Interest, Funding Rate, and RSI Signal Explained

As the 10-year US Treasury yield breaks above 5% and Japanese bond yields fall below 3%, global bond market pressure surges!
Global bond markets are sounding the alarm as US Treasury yields break 5%, reaching their highest level since 2007, and Japanese bond yields hit a 30-year high. Soaring oil prices, persistent inflation, and mounting debt are triggering a wave of sell-offs. Institutions warn: 5% is by no means the endpoint—6% is now in sight! With US and Japan central bank decisions imminent this week, a more intense asset storm may just be beginning.
Crypto prices
More


