

Date: Sun, Aug 10, 2025 | 04:54 AM GMT
The cryptocurrency market is flashing bullish signals as Ethereum (ETH) crosses the $4,200 mark for the first time since 2021. This breakout has ignited a broader rally, lifting several major altcoins and memecoins — with Hyperliquid (HYPE) among the standout performers.
HYPE has surged nearly 7% in the last 24 hours, extending its weekly gains to over 17%. More importantly, its current price structure is showing signs of a repeating fractal pattern, a setup that may provide valuable hints about its next move.
 Source: Coinmarketcap
HYPE Mirrors BNB’s Structure
A closer look at the daily charts of HYPE and Binance Coin (BNB) reveals a striking similarity. The current formation on HYPE’s chart is echoing the pattern BNB printed in mid-2019, right before a significant corrective phase.
In BNB’s case, the token staged a strong rally, followed by a series of phase-wise corrections. Key inflection points appeared where price broke below its 25-day moving average (orange line) before staging smaller bouncebacks — only to roll over again.
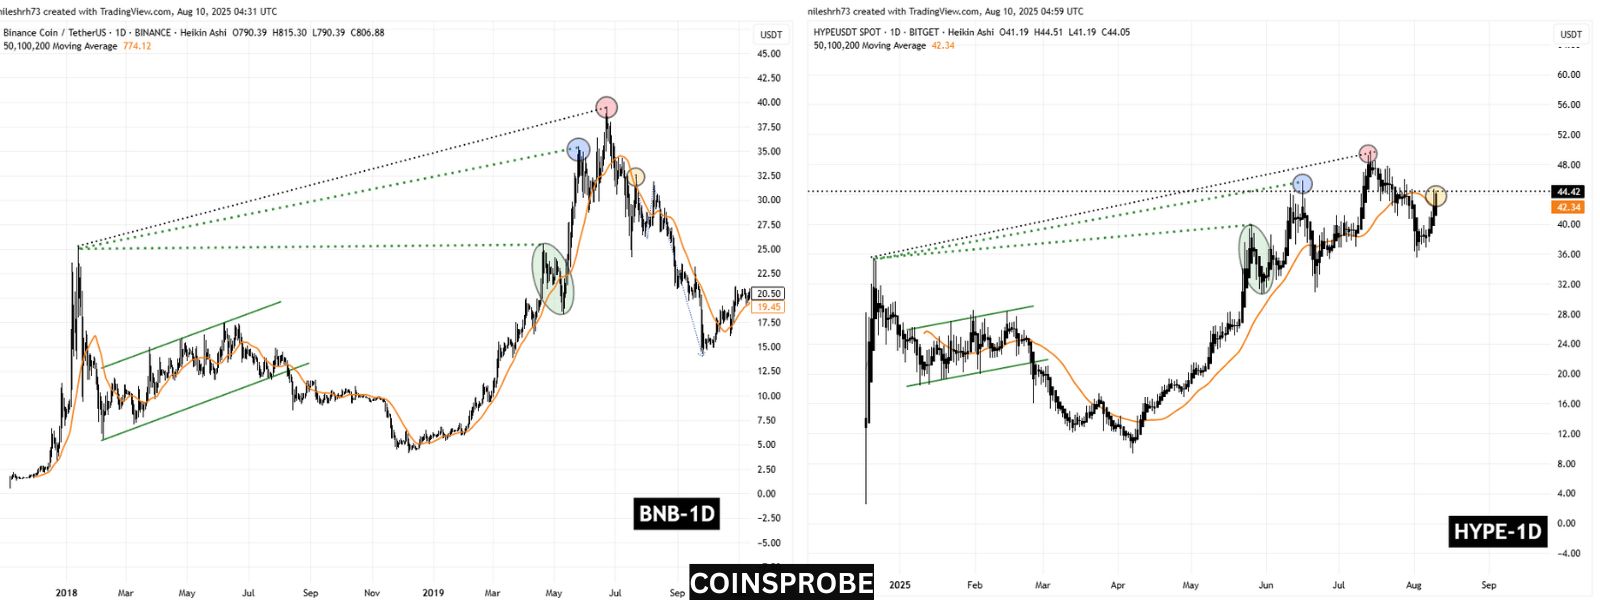 BNB and HYPE Fractal Chart/Coinsprobe (Source: Tradingview)
HYPE appears to be walking the same technical path.
After a major rally earlier this year, the token has also seen multi-stage pullbacks. The latest bounce is occurring right in the “yellow zone” equivalent to where BNB’s 2019 move paused before its larger drop. This parallel is fueling speculation that HYPE may be nearing an inflection point of its own.
What’s Next for HYPE?
While fractal patterns are not foolproof, the resemblance between HYPE’s current trajectory and BNB’s historic move is difficult to ignore. The immediate level to watch is the 25-day moving average support at $42.34.
A decisive break below this level could add weight to the bearish fractal scenario, potentially opening the door for a deeper pullback toward the mid-$25 range. On the other hand, if HYPE holds this support and pushes beyond its recent all-time high of $49.88, the fractal setup would be invalidated, signaling renewed bullish momentum and the possibility of new highs.


