Bitget App
Trade smarter
Buy cryptoMarketsTradeFuturesEarnAISquareMore
Pepe (PEPE) To Soar Higher? Key Harmonic Pattern Signaling Potential Upside Move

Pepe (PEPE) To Soar Higher? Key Harmonic Pattern Signaling Potential Upside Move

CoinsProbeCoinsProbe2025/08/09 09:40
By:Nilesh Hembade

Date: Sat, Aug 09, 2025 | 09:10 AM GMT

The cryptocurrency market is firmly in bullish mode as Ethereum (ETH) surged past the $4,150 mark for the first time since 2021. This 6% daily jump has ignited a broader rally, lifting major memecoins — including Pepe (PEPE).

PEPE has impressed with an 10% spike in the past 24 hours, and its price chart is now flashing a familiar harmonic setup that could hint at where it’s headed next.

Pepe (PEPE) To Soar Higher? Key Harmonic Pattern Signaling Potential Upside Move image 0 Source: Coinmarketcap

Harmonic Pattern Hints at Potential Bounce

On the daily timeframe, PEPE is shaping up a Bearish ABCD harmonic pattern — a classic formation that, despite the bearish label, often features a bullish CD leg before price reaches the potential reversal zone (PRZ).

The move began with a strong push from point A near $0.00000831 to point B, followed by a pullback to point C around $0.00001004, where buyers stepped back in. Since then, the price has rallied again and is now hovering near $0.00001232, confirming that the CD leg is in progress.
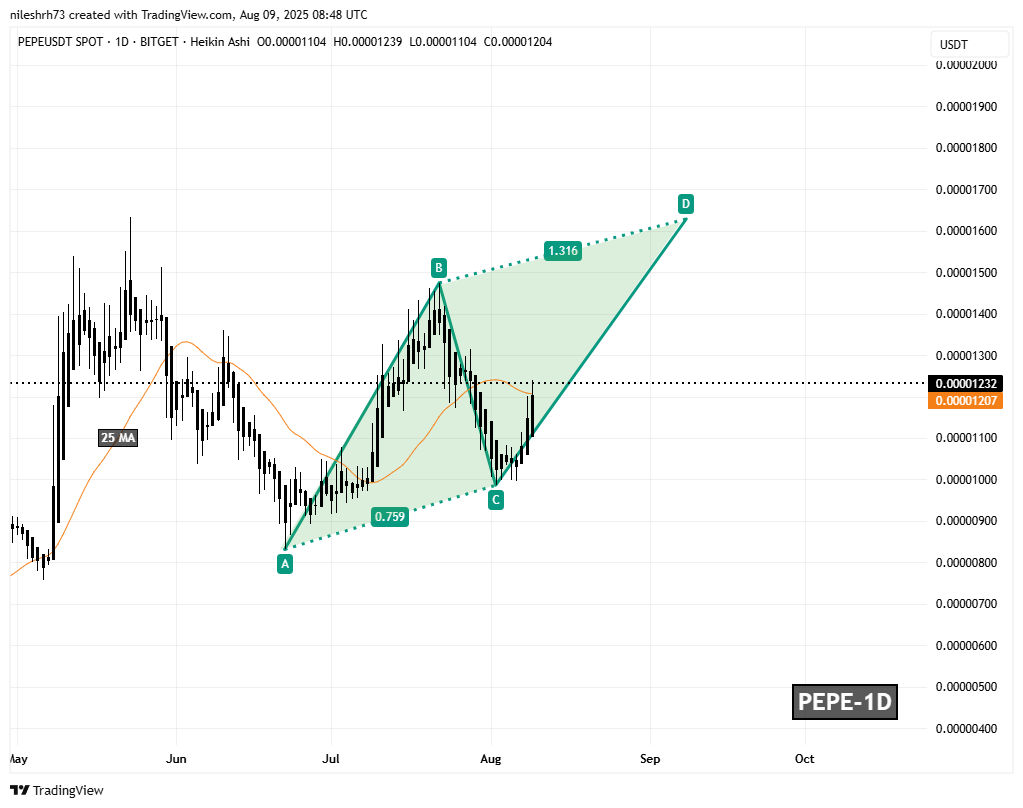
Pepe (PEPE) To Soar Higher? Key Harmonic Pattern Signaling Potential Upside Move image 1 Pepe (PEPE) Daily Chart/Coinsprobe (Source: Tradingview)

According to harmonic projections, the CD leg could extend toward the 1.31 Fibonacci extension of the BC leg, setting up a PRZ around $0.00001628. If hit, this would translate to roughly a 32% upside from current levels.

What’s Next for PEPE?

Momentum currently leans in the bulls’ favor. A sustained move toward the $0.00001628 target would complete the ABCD pattern, though this area could also become a major resistance level where traders might take profits.

On the flip side, PEPE needs to maintain support above its 25-day moving average — now around $0.00001207. Losing this level could undermine the bullish setup and open the door to deeper consolidation.

0
0

Disclaimer: The content of this article solely reflects the author's opinion and does not represent the platform in any capacity. This article is not intended to serve as a reference for making investment decisions.

Understand the market, then trade.
Bitget offers one-stop trading for cryptocurrencies, stocks, and gold.
Trade now!

You may also like

Morgan Stanley declares that physical AI and space will become the “new electricity” of the economy! Increases holdings of SpaceX (SPCX.US), target price $300

Morgan Stanley has released a research report on physical AI, space, and SpaceX (SPCX.US), stating that robotics and the space industry will reshape the global economic landscape, with their impact comparable to that of electricity in modern economies.

智通财经2026/09/15 06:56
Morgan Stanley declares that physical AI and space will become the “new electricity” of the economy! Increases holdings of SpaceX (SPCX.US), target price $300

ECB Vice President sounds the "bubble alarm": AI asset valuations are "very high," stock markets are prone to corrections

European Central Bank Vice President Vujičić warns: Asset rallies driven by artificial intelligence are prone to correction risks.

智通财经2026/09/15 06:56
ECB Vice President sounds the "bubble alarm": AI asset valuations are "very high," stock markets are prone to corrections

Broadcom (AVGO.US) CEO Responds to "AI Brakes" Theory: AI Semiconductor Revenue Target Remains Unchanged, Aiming for $230 Billion by 2028

Chen Fuyang recently addressed concerns during an interview about the potential impact of slowing frontier AI model development on the chip manufacturer's business, emphasizing that the company remains committed to its long-term revenue targets.

智通财经2026/09/15 06:56
Broadcom (AVGO.US) CEO Responds to "AI Brakes" Theory: AI Semiconductor Revenue Target Remains Unchanged, Aiming for $230 Billion by 2028

10-year U.S. Treasury yield breaks above 5% to nearly a 20-year high, Fed's anti-inflation credibility faces major test

The yield on the US 10-year Treasury has risen to its highest level in nearly 20 years, marking the latest milestone in the global bond sell-off.

智通财经2026/09/15 06:46
10-year U.S. Treasury yield breaks above 5% to nearly a 20-year high, Fed's anti-inflation credibility faces major test