
Shiba Inu Price Breakdown Likely as It Appears to Be the Weakest Pup in the Meme Pack

SHIBA INU (SHIB) price is underperforming while the rest of the meme coin pack is running wild. Dogecoin is up 29.8% in the past 30 days, BONK is up 20.4%, PENGU soared 151.1%, and even PEPE is up over 9%. SHIB? Just 7.9%. As the meme coin index jumps 6.2% in the past 24 hours, … <a href="https://beincrypto.com/shiba-inu-price-breakdown-risk-august-2025/">Continued</a>
SHIBA INU (SHIB) price is underperforming while the rest of the meme coin pack is running wild. Dogecoin is up 29.8% in the past 30 days, BONK is up 20.4%, PENGU soared 151.1%, and even PEPE is up over 9%. SHIB? Just 7.9%.
As the meme coin index jumps 6.2% in the past 24 hours, SHIB is struggling inside a tight pennant, and breakdown risks are rising.
Large Holders Keep Selling, And That’s a Red Flag
The large holder netflow trend for SHIB has been clearly negative. Over the past 30 days, whales have trimmed their SHIB positions by over 181%. Over the last 3 months, there’s been no significant inflow either.
While negative exchange netflows often mean holders are not selling, in this case, the large wallet exits matter more, since these are likely headed to exchanges or other liquidation paths. Large holders’ netflow turning negative is bearish, unlike exchange netflow turning negative. In simpler terms, they mean the opposite things.
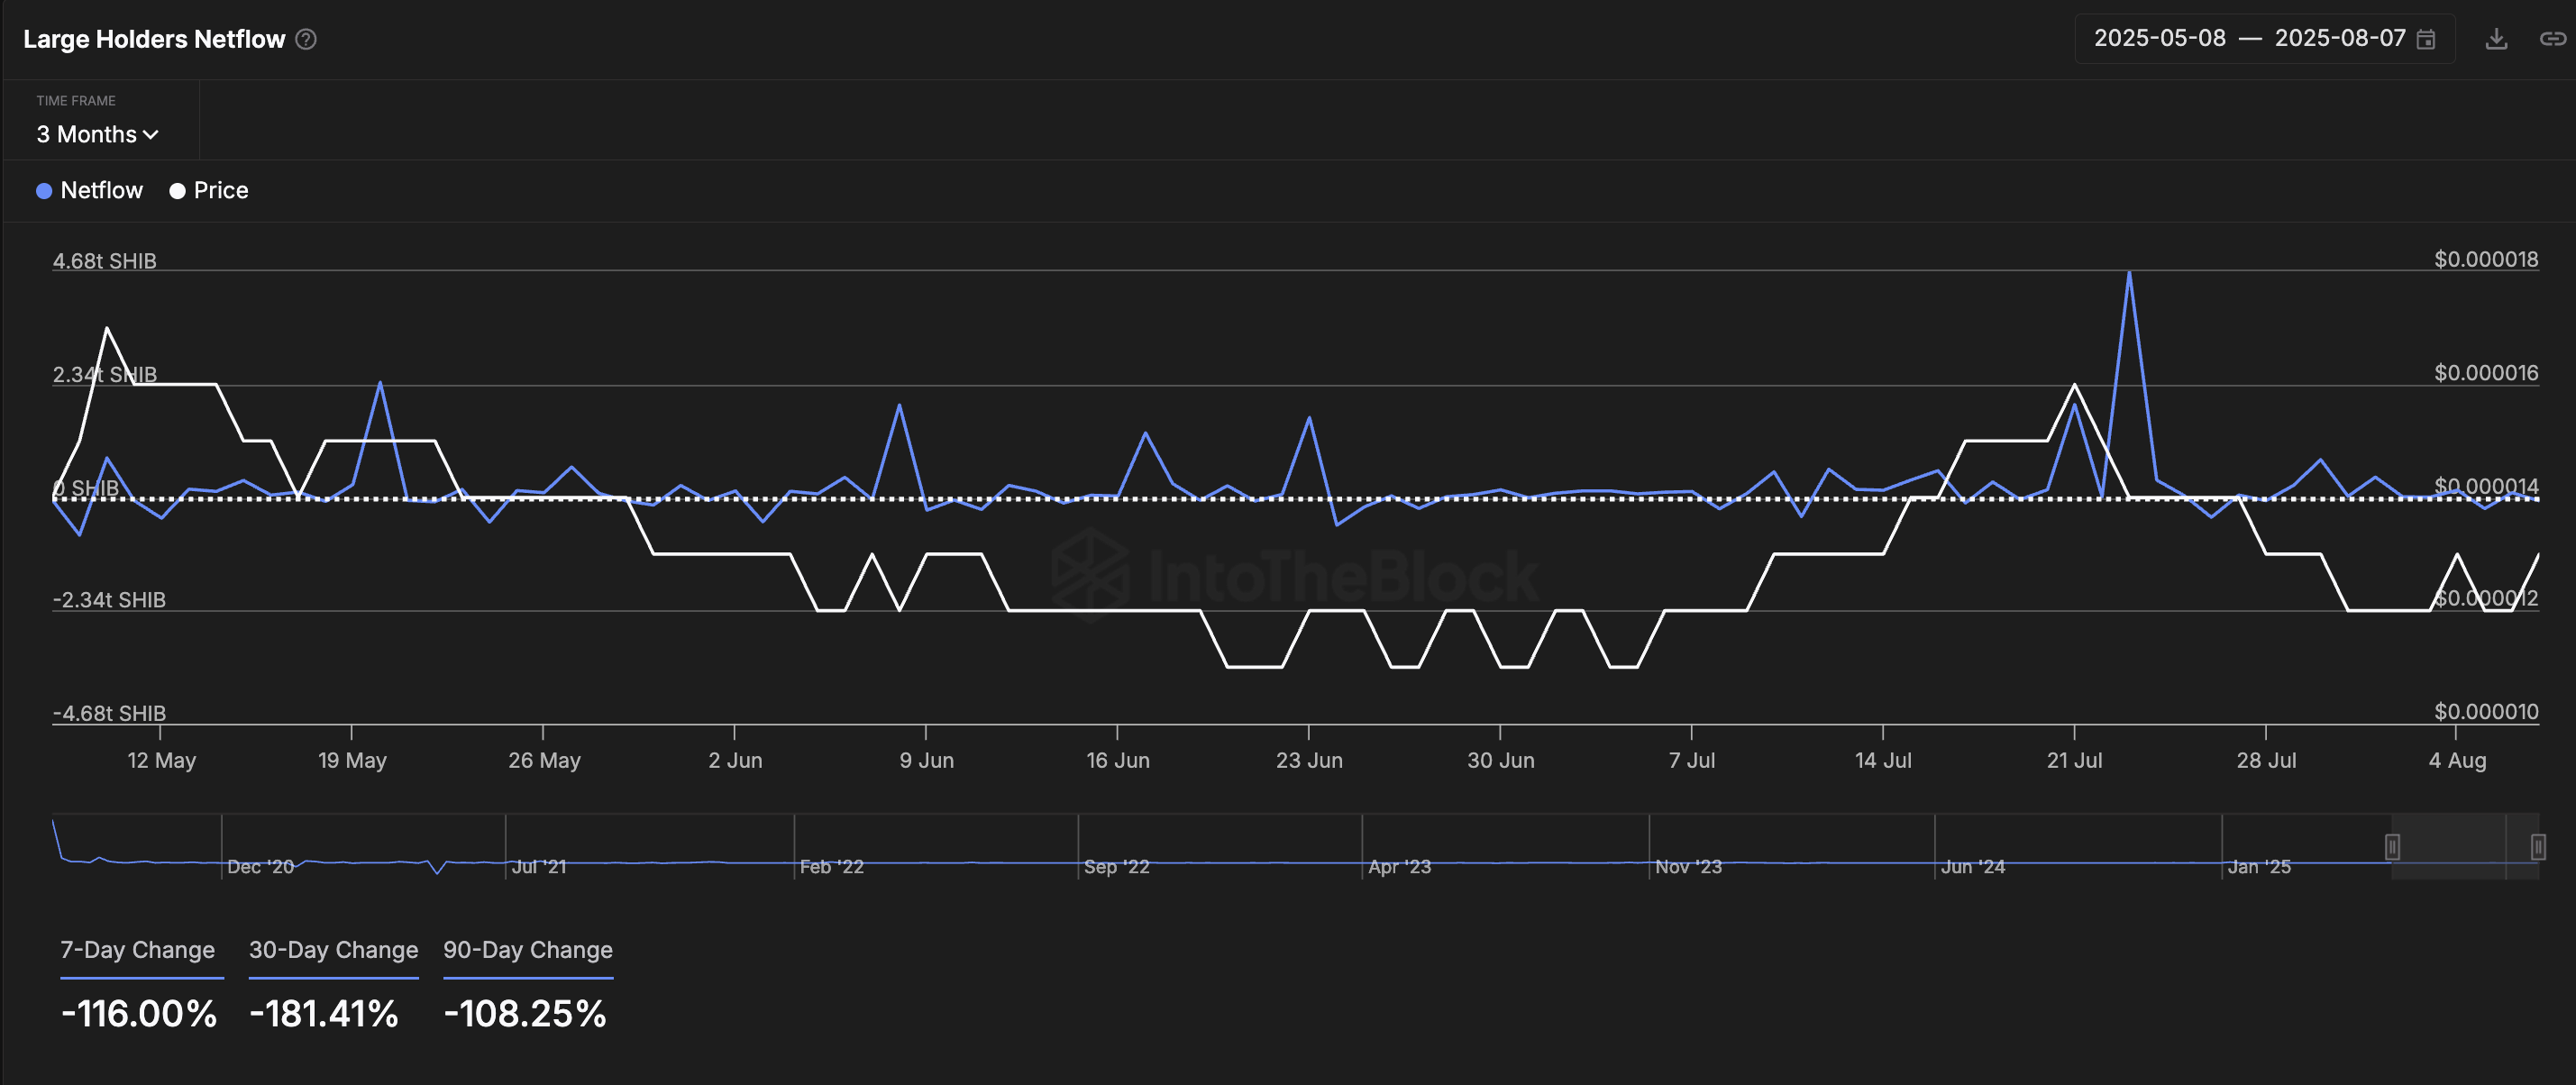 Shiba Inu price and large holder netflow:
IntoTheBlock
Shiba Inu price and large holder netflow:
IntoTheBlock
The current SHIB price metric shows that whales are not accumulating or holding. Instead, they’re reducing exposure. If this continues, it may lead to more supply pressure down the road, especially if retail also starts exiting.
For token TA and market updates: Want more token insights like this? Sign up for Editor Harsh Notariya’s Daily Crypto Newsletter here.
Weak Support Clusters Add to Breakdown Concerns
According to global in- and out-of-money data, SHIB’s current price range ($0.000012–$0.000013) constitutes a weak support cluster. Only 312,850 addresses are holding SHIB in the next lower zone. That means if SHIB breaks below $0.000012, it could fall quickly toward $0.000008, because there aren’t enough buyers at lower levels to absorb the selling.
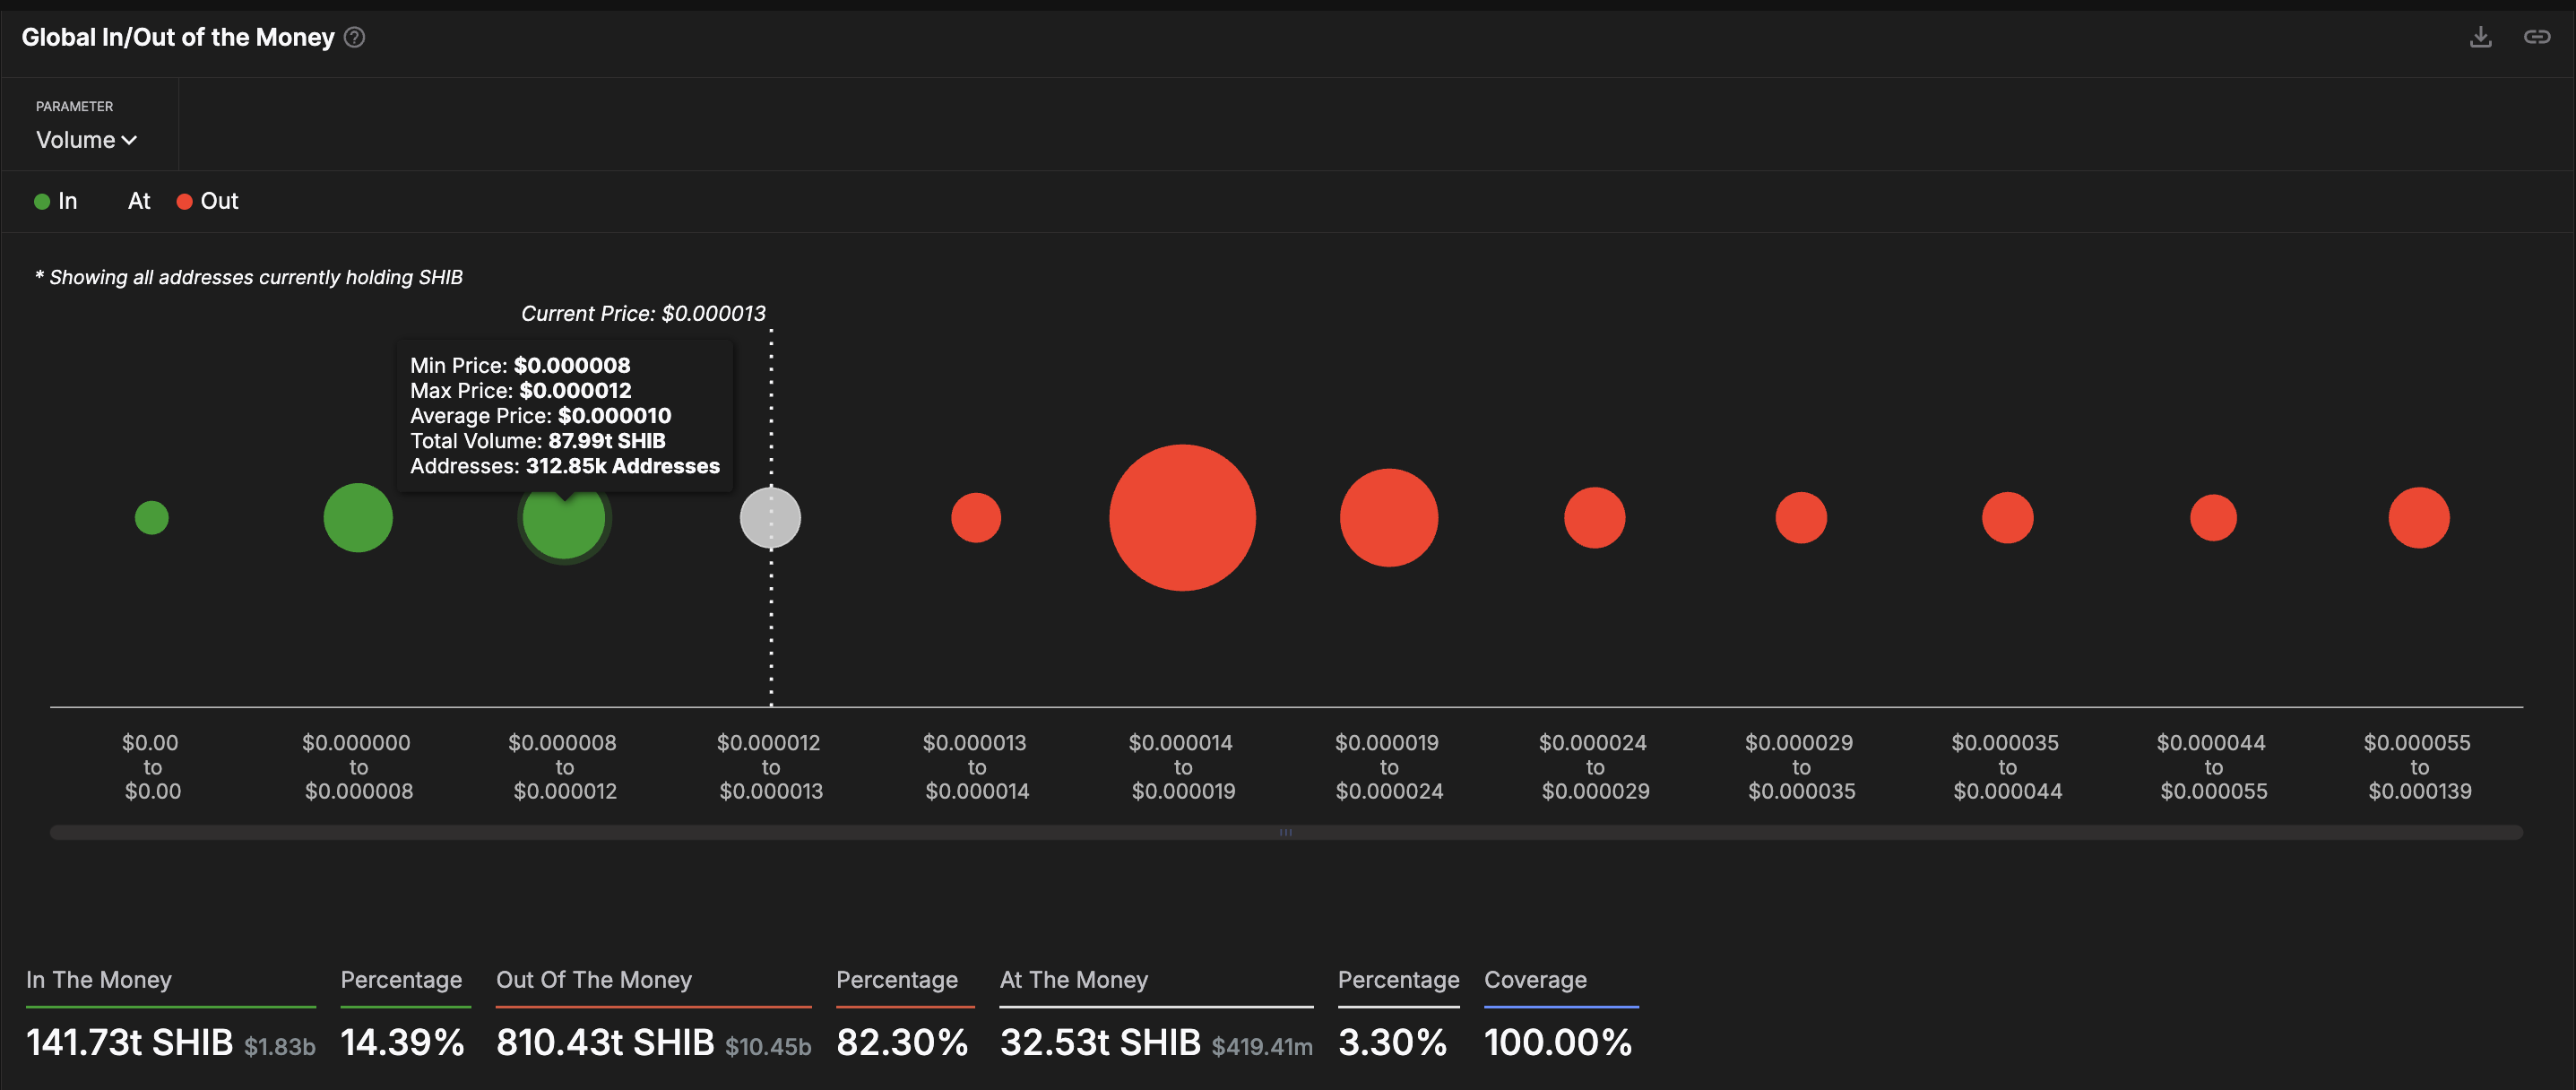 SHIB price and weak support levels:
IntoTheBlock
SHIB price and weak support levels:
IntoTheBlock
While the good news is that most holders are out of the money (and unlikely to sell at a loss), this also means there’s little cushion if the price drops.
Even small dips could unlock sharp downside due to weak on-chain support.
Bearish Pennant Hints at Shiba Inu Price Breakdown
On the 2-day price chart, SHIB is forming a pennant pattern, which can break either way. But right now, the price is hovering near the lower trendline of the pennant around $0.00001158, and a clean break below this level could signal a full pattern breakdown. The Shiba Inu price has attempted a few rebounds from the lower trendline already.
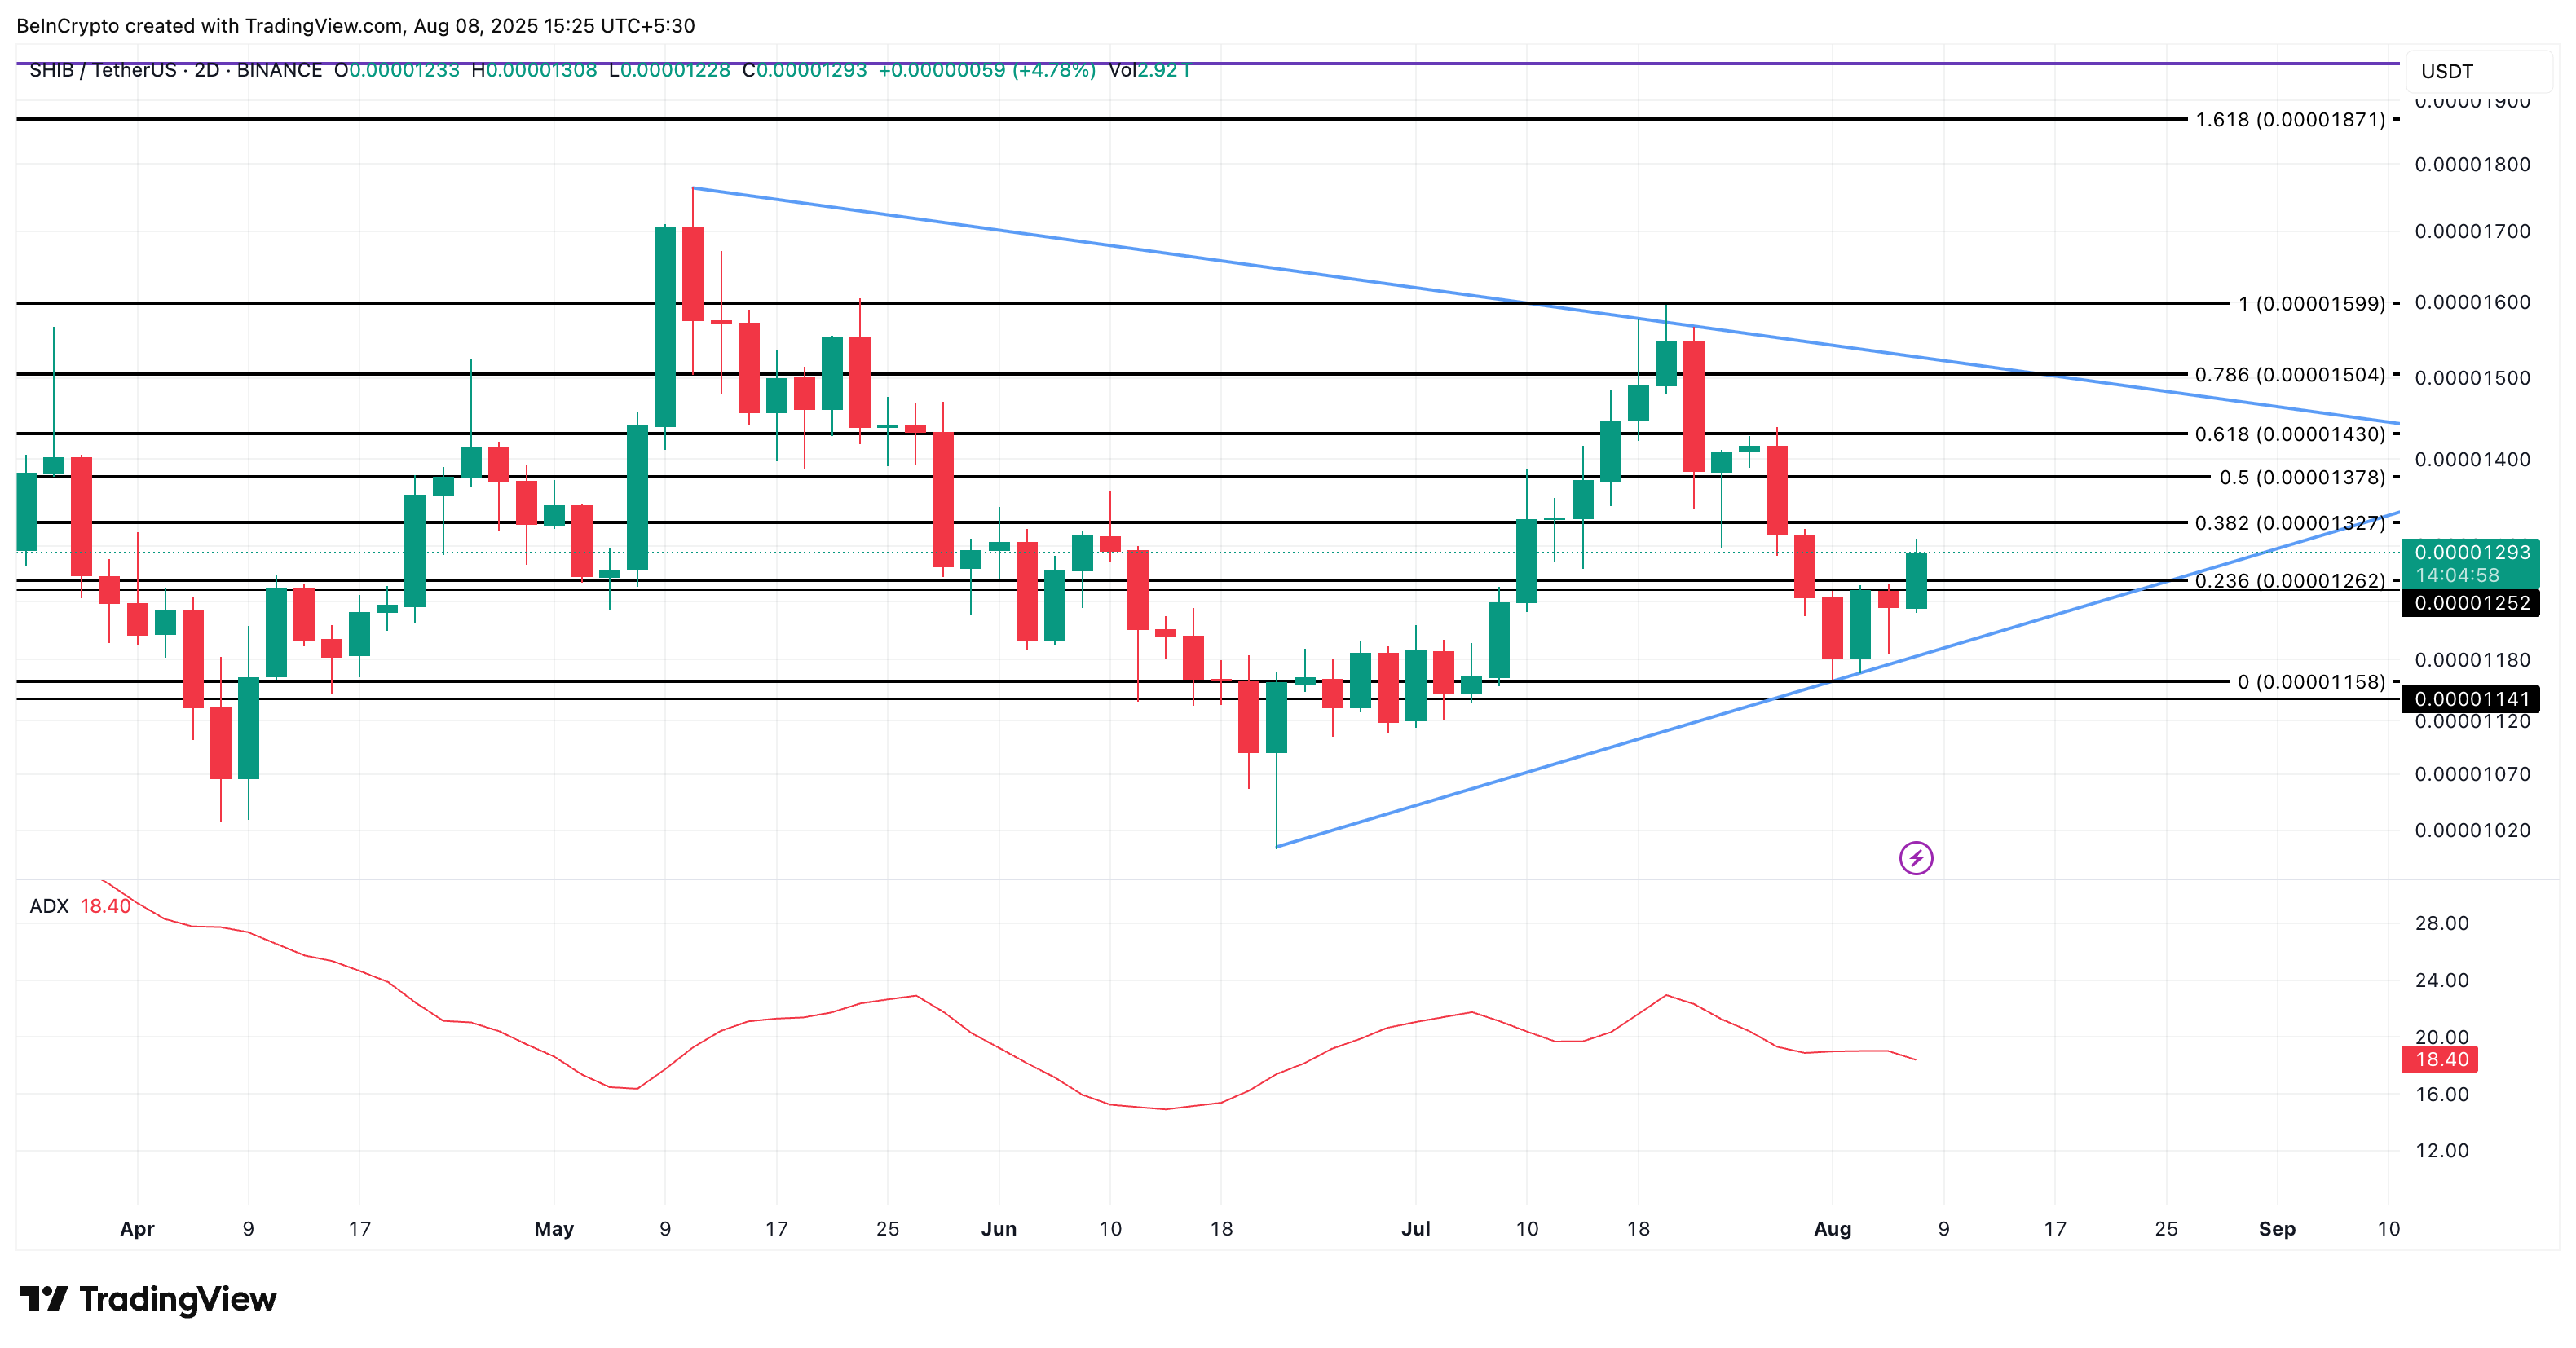 Shiba Inu price analysis:
TradingView
Shiba Inu price analysis:
TradingView
Adding to this, the Average Directional Index (ADX) has weakened. It dropped from 22 (mid-July) to 18.4, showing that the overall trend strength is fading. A falling ADX near a pattern support line typically means the price could roll over without strong buying interest to stop it.
The Average Directional Index (ADX) measures how strong a price trend is; whether it’s going up or down, and a falling ADX means the trend is weakening, not gaining momentum.
If SHIB loses support at $0.0000115, it could fall lower, also confirmed by the In-and-Out of money setup. On the other hand, for this bearish setup to be invalidated, SHIB would need to flip above $0.0000132 and $0.0000137 first. However, the trend would turn bullish if it can break past the pennant resistance, specifically around $0.0000150.
Disclaimer: The content of this article solely reflects the author's opinion and does not represent the platform in any capacity. This article is not intended to serve as a reference for making investment decisions.
You may also like
BUILDon rallies as holders hit record 87,320 – Can B extend its gains?
Goldman Sachs Hedge Fund Chief: "Zero-Day Options" Suppress U.S. Stock Volatility, Technology and Energy Remain the Best Choices
The S&P 500 has experienced intraday fluctuations of less than 1% for 27 consecutive trading days, marking the longest period of low volatility since the pandemic. Goldman Sachs warns that this "calm" is the result of zero-day options strategies forcibly locking in the market, and once a catalyst emerges, the compressed volatility energy will be released all at once. Meanwhile, expectations for a rate hike in September are rising, market sentiment has dropped to its lowest point of the year, and fiscal sustainability risks loom large—is this pot of heating water going to boil for much longer?
Balancer eyes wind-down after restructuring fails to revive revenue
Is a new wave of sell-offs approaching? The ultimate rival of the AI bull market emerges—The "global anchor of asset pricing" breaks through the 5% super threshold
After the 10-year US Treasury yield breaks back above the critical 5% mark, it is more likely to usher in a period of high-level tug-of-war and accelerated asset differentiation. Especially before energy shocks and the significantly eased large-scale expansion of the US fiscal deficit, the conditions to quickly replicate the sharp yield decline seen at the end of 2023 are not yet fully in place.

Crypto prices
More


