
Mantle (MNT) Price Rally Hits a Wall Despite Buyers In Control: Here’s What Happens Next

Mantle’s breakout may be pausing; but don’t count buyers out just yet. Negative netflows and strong holding behavior still suggest strength beneath the surface.
Mantle (MNT) rallied over 12% in just a few hours, powered by growing network activity and a surge in stablecoin liquidity. But after closing in on a key resistance zone near $1.12, the Mantle price rally seems to be cooling.
Short-term momentum is fading, and price action risks turning sideways. Still, on-chain data shows buyers aren’t done yet; at least not until one key signal flips.
Buyers Stay in Control as Net Flows Remain Negative
Despite the recent pause in MNT’s rally, net exchange flows have stayed negative since launch. That means more MNT tokens are leaving exchanges than entering, a strong sign that traders are still choosing to hold rather than sell. This trend has remained intact even after the recent +12% surge, showing that retail conviction hasn’t faded.
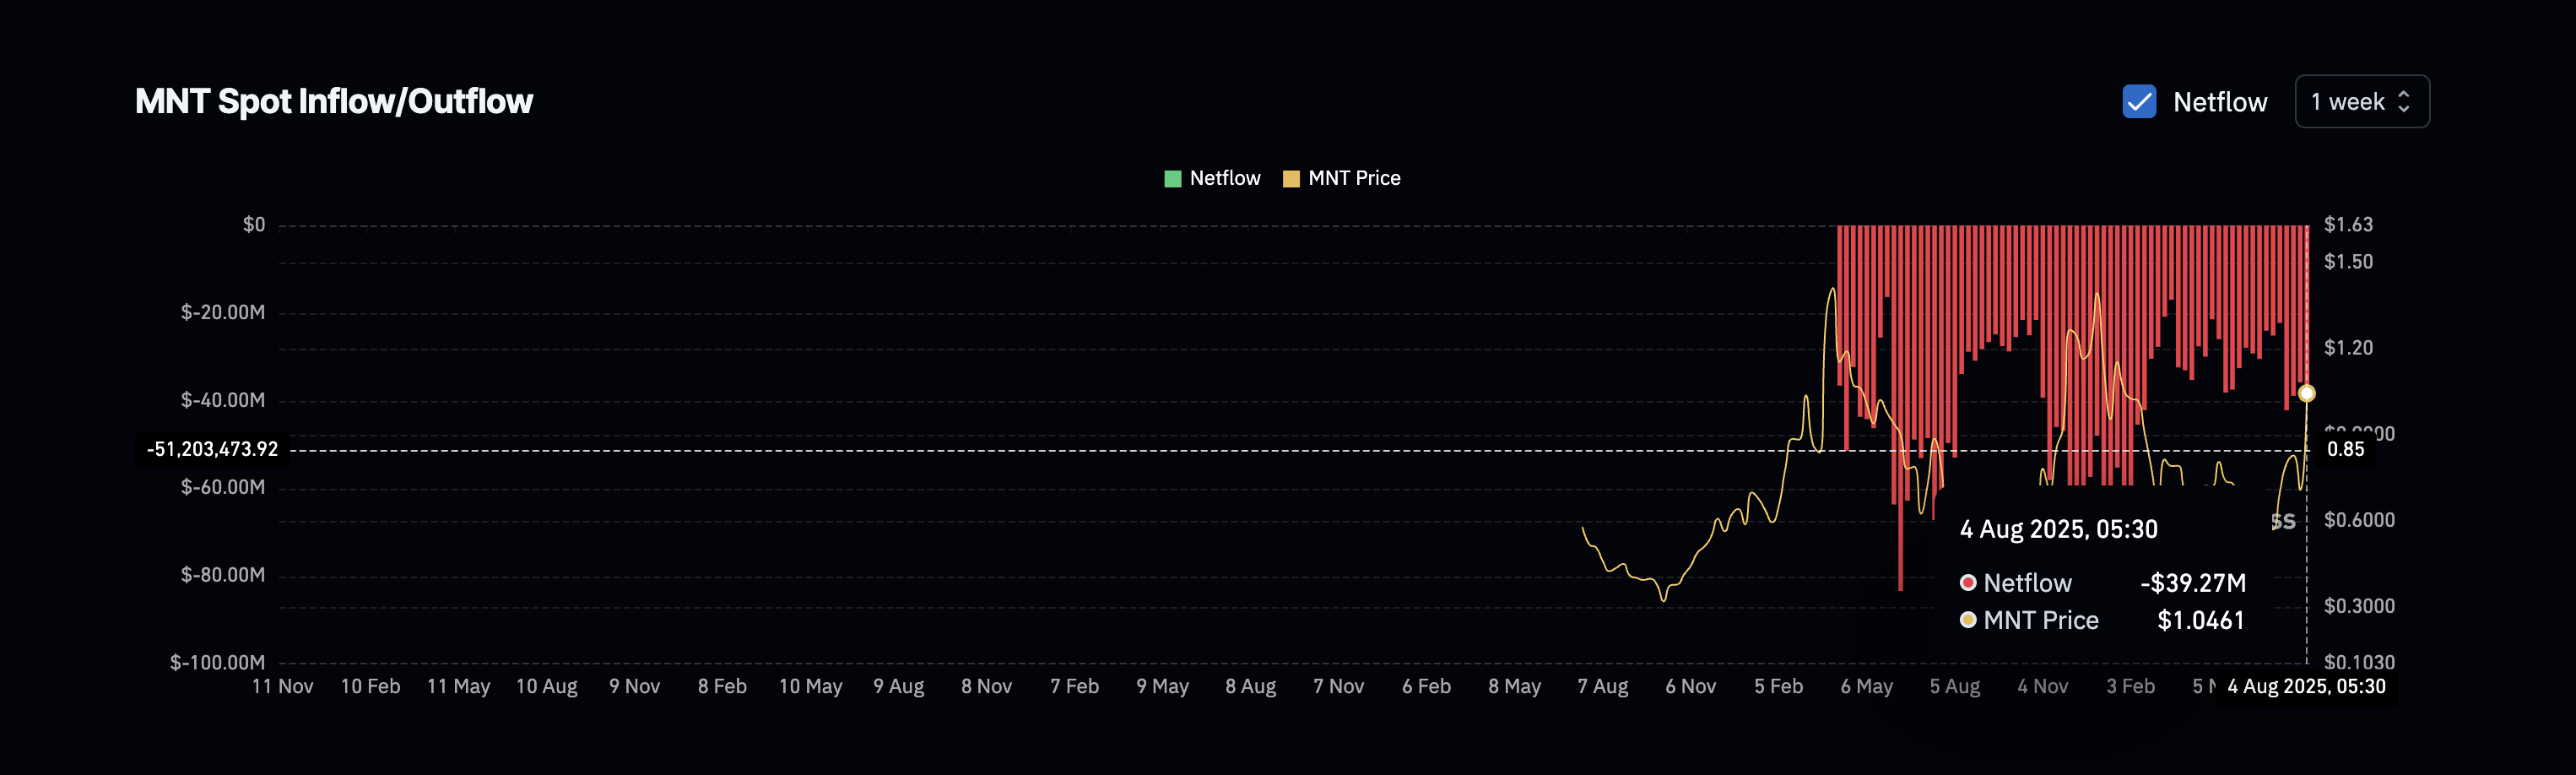 Mantle price and netflows:
However, smart money wallets have shown signs of caution. Over the past 7 days, they dropped 1.33 million MNT, trimming holdings by 3.76%, according to Nansen.
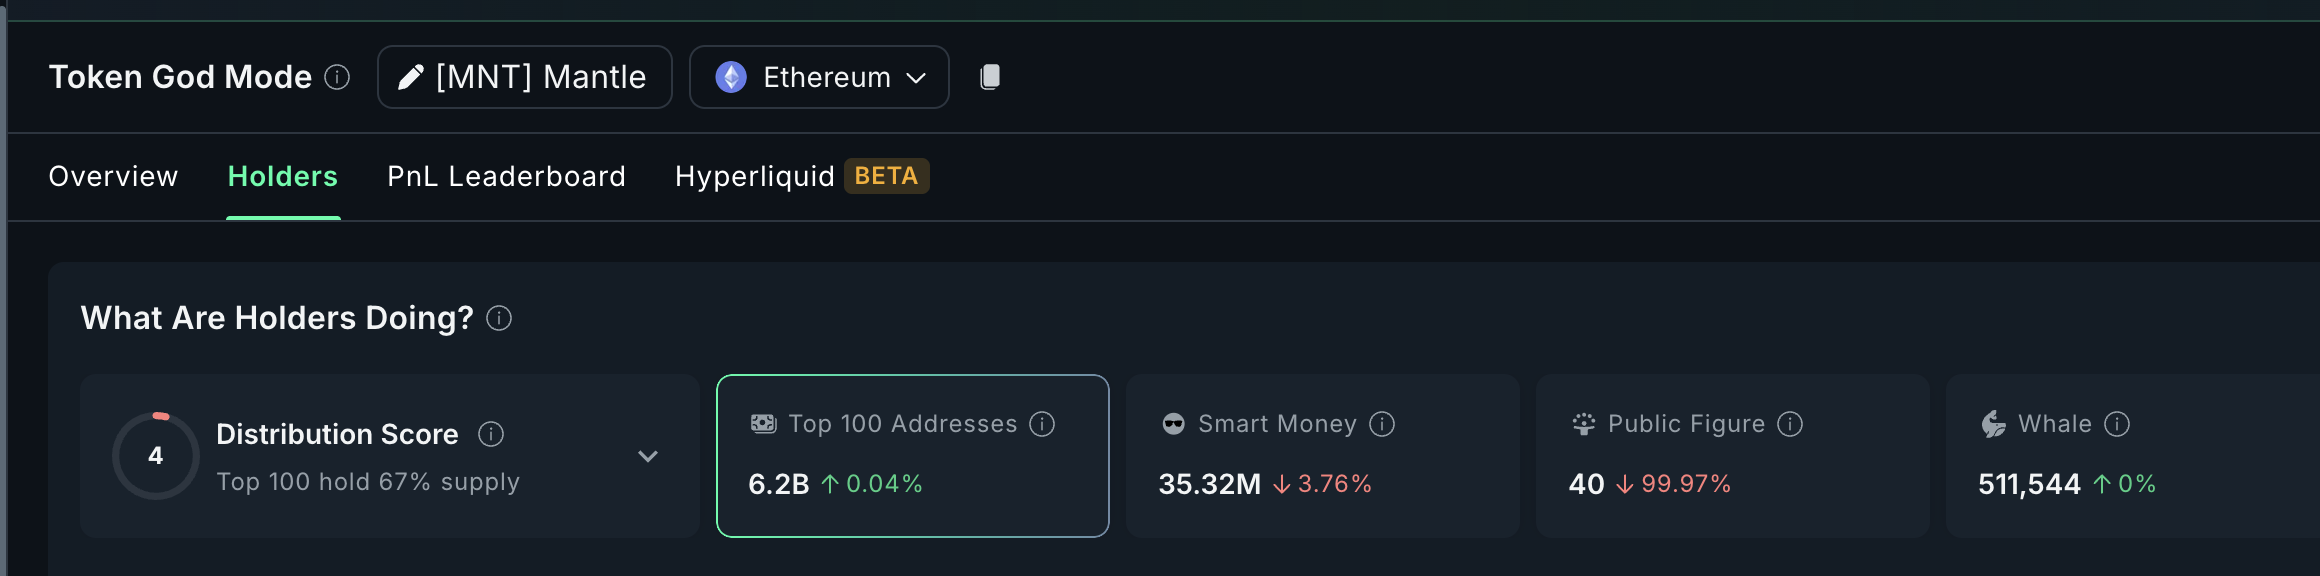 Mantle price and smart money trimming positions:
In contrast, the top 100 addresses added 2.48 million MNT. This move suggests that larger holders are still confident despite some short-term Smart Money-led profit-taking.
This split sets the stage for consolidation. If smart money continues to trim and exchange outflows persist, we may see sideways action rather than a sharp correction. However, if profit-taking takes center stage with increased inflows, all while smart money continues to trim, a deeper dip could be on the cards.
For token TA and market updates: Want more token insights like this? Sign up for Editor Harsh Notariya’s Daily Crypto Newsletter.
Mantle Price Rallies, But Momentum Flashes Caution
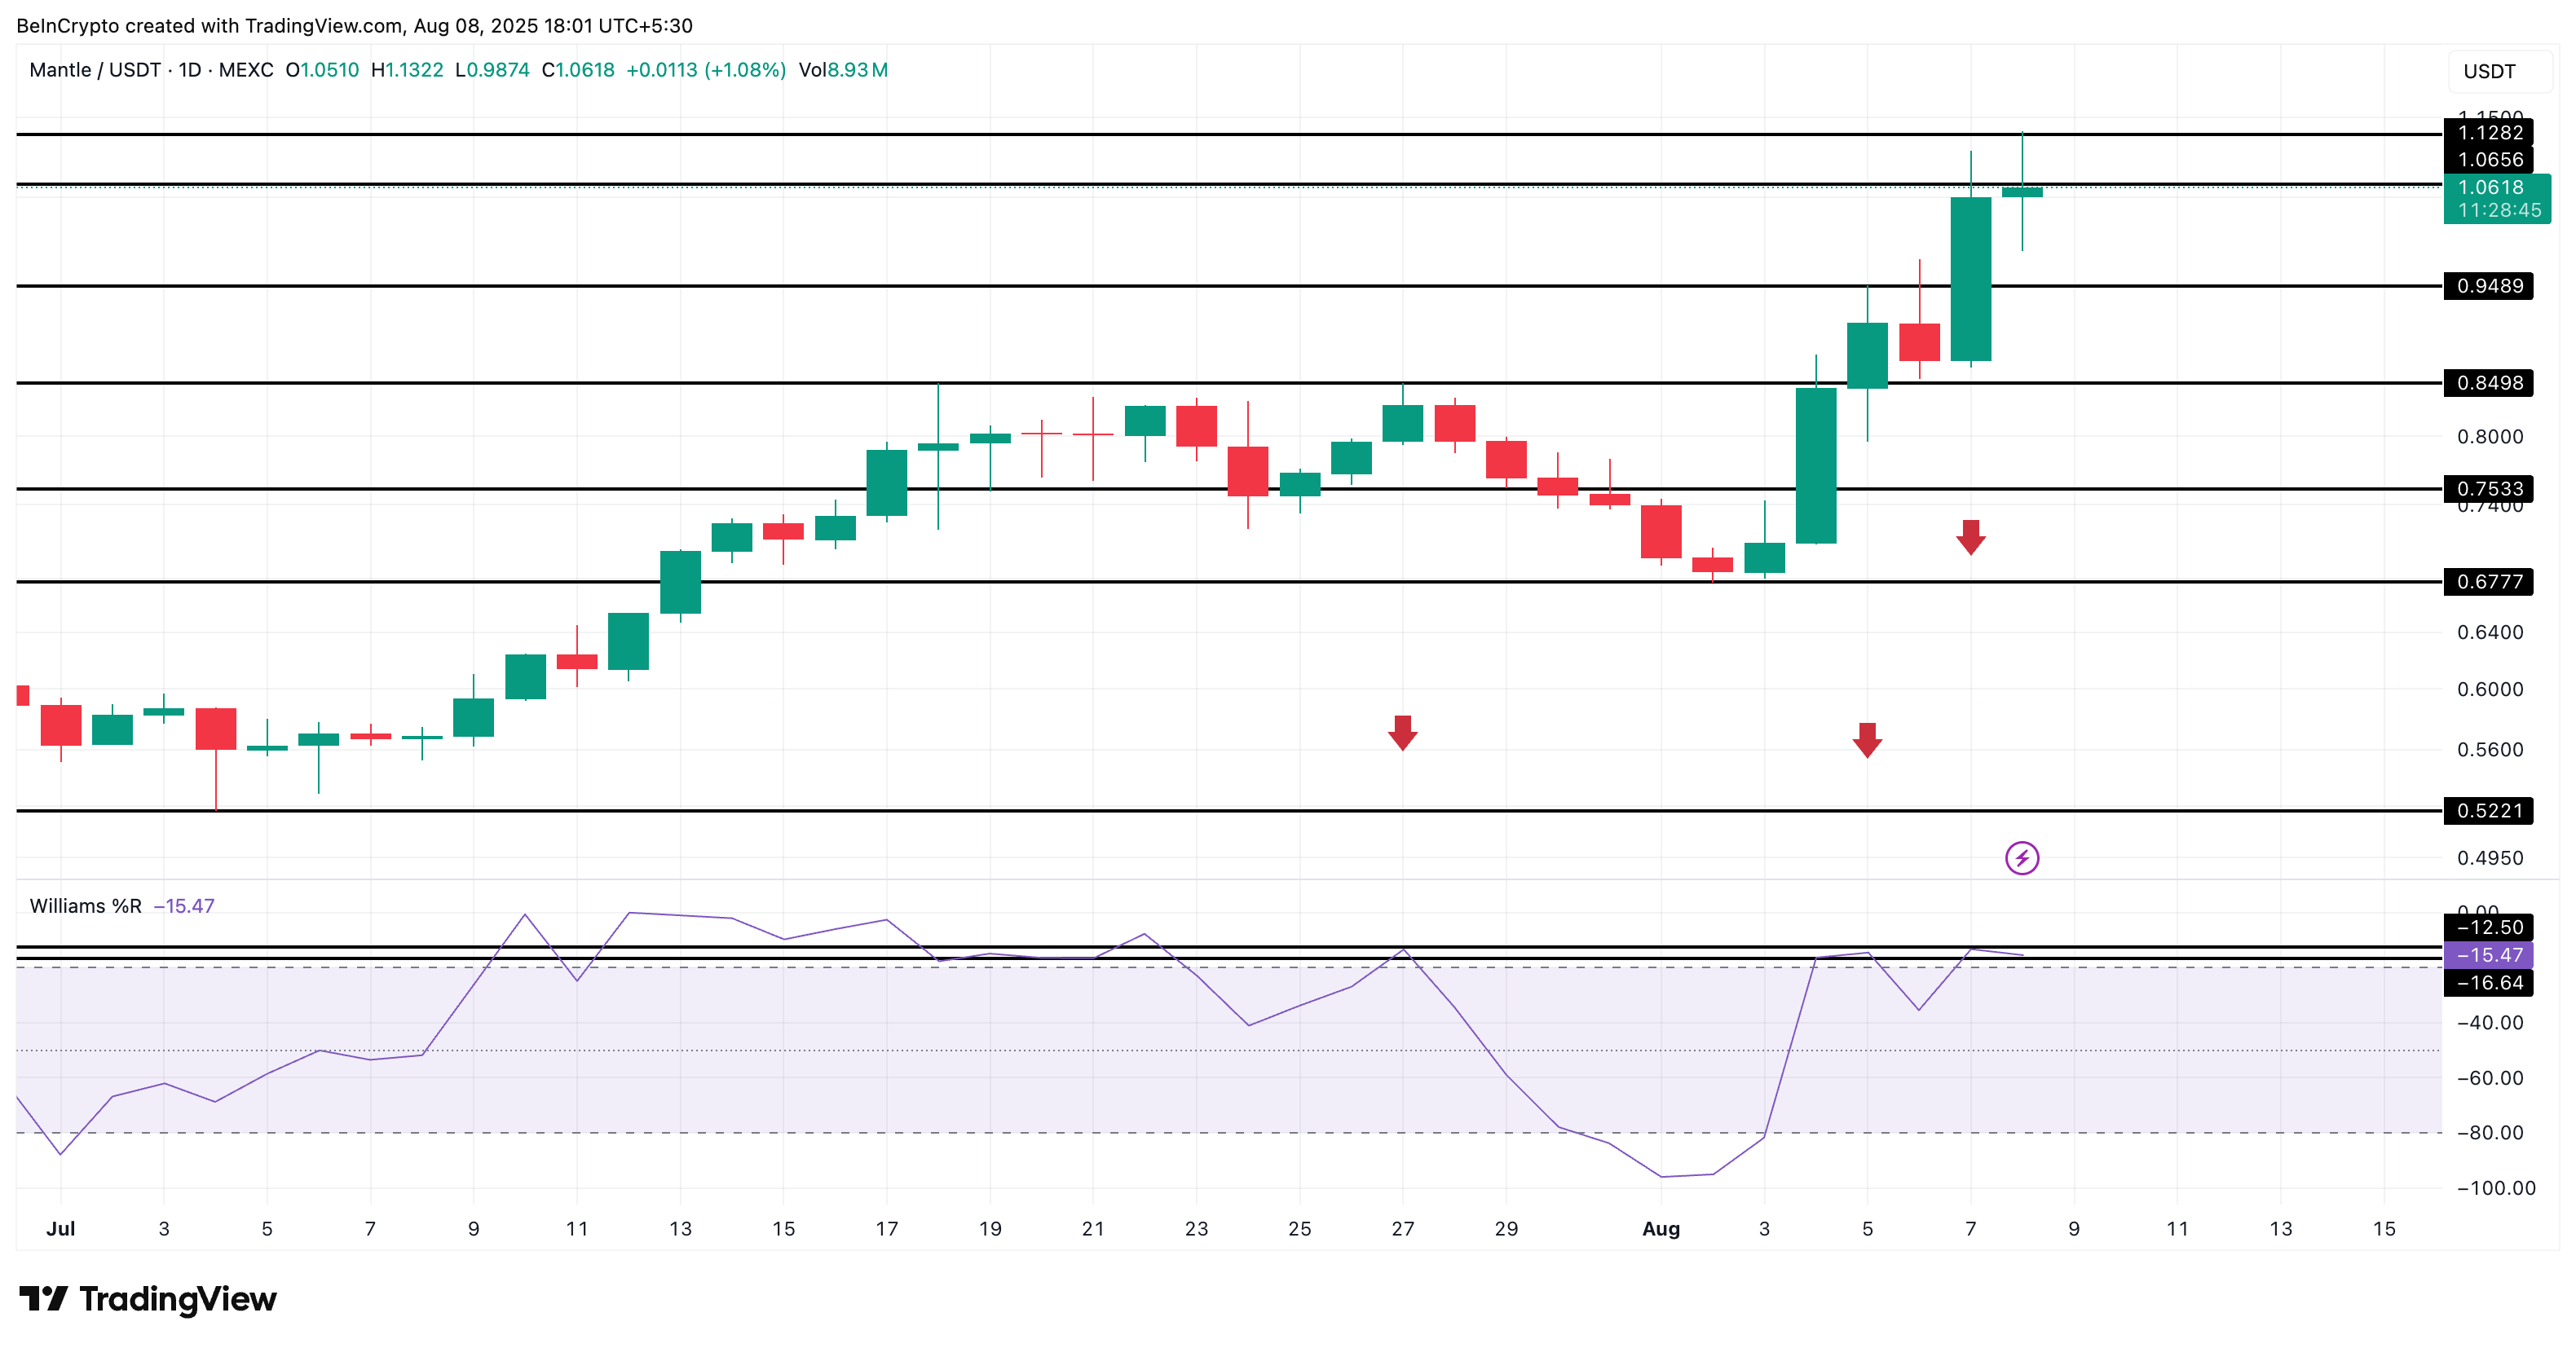
The Mantle (MNT) price has seen a few local tops in recent weeks, each aligning with a spike in the Williams %R oscillator, a momentum indicator that helps identify when an asset becomes overbought (reading near 0) or oversold (near -100).
On July 27, Williams %R hit around -12, indicating strong overbought conditions. The MNT price dropped sharply in the following sessions.
 Mantle price analysis:
Between August 4-5, the Mantle price rallied to above $0.94 (local top). The Williams %R formed a local top here as well. That top was lower than the one experienced on July 27. This meant that MNT entered a sideways phase shortly after, not a corrective phase.
Now, after the latest rally on August 7, Williams %R is back near the levels touched on July 27. This creates a familiar setup; similar readings have preceded sharper corrections.
Williams %R is a fast-reacting momentum indicator that spots short-term overbought or oversold levels. Unlike RSI, it responds quicker to local tops, making it ideal for tracking sudden rallies like Mantle’s.
If this pattern repeats, MNT could revisit $0.94 or $0.84 before its next major move. However, if profit-taking kicks in, and netflows flip positive (indicating tokens moving to exchanges), the pullback could be steeper. A break under $0.67 invalidates the bullish structure.
While the broader market sentiment is still bullish, these momentum shifts hint that MNT might need to cool off, at least temporarily, before making another attempt at a sustained breakout above $1.12.
Disclaimer: The content of this article solely reflects the author's opinion and does not represent the platform in any capacity. This article is not intended to serve as a reference for making investment decisions.
You may also like
BUILDon rallies as holders hit record 87,320 – Can B extend its gains?
Goldman Sachs Hedge Fund Chief: "Zero-Day Options" Suppress U.S. Stock Volatility, Technology and Energy Remain the Best Choices
The S&P 500 has experienced intraday fluctuations of less than 1% for 27 consecutive trading days, marking the longest period of low volatility since the pandemic. Goldman Sachs warns that this "calm" is the result of zero-day options strategies forcibly locking in the market, and once a catalyst emerges, the compressed volatility energy will be released all at once. Meanwhile, expectations for a rate hike in September are rising, market sentiment has dropped to its lowest point of the year, and fiscal sustainability risks loom large—is this pot of heating water going to boil for much longer?
Balancer eyes wind-down after restructuring fails to revive revenue
Is a new wave of sell-offs approaching? The ultimate rival of the AI bull market emerges—The "global anchor of asset pricing" breaks through the 5% super threshold
After the 10-year US Treasury yield breaks back above the critical 5% mark, it is more likely to usher in a period of high-level tug-of-war and accelerated asset differentiation. Especially before energy shocks and the significantly eased large-scale expansion of the US fiscal deficit, the conditions to quickly replicate the sharp yield decline seen at the end of 2023 are not yet fully in place.

Crypto prices
More


