- DOGE retests critical support zone after 30% rally asPrice action confirms a key breakout zone near $0.19 now acting as support.
- Technical indicators show bullish continuation signs asRSI sits above 70 and MACD prints a bullish crossover, indicating sustained momentum.
- Upside targets suggest potential 2x move as projected price levels point to a move toward $0.44–$0.46 if the retest confirms successfully.
Dogecoin (DOGE) has recently reclaimed critical levels after a pronounced rally that saw prices rise more than 30%. The meme-based digital asset is now in the midst of a notable technical retest. Based on recent price activity and chart structure, analysts are monitoring a possible continuation phase, with price models suggesting a potential 2x move if the current consolidation confirms support. DOGE was currently trading near $0.199 , with short-term consolidation forming just above previous resistance-turned-support zones.
DOGE Retests Breakout Zone With Upside Targets in Focus
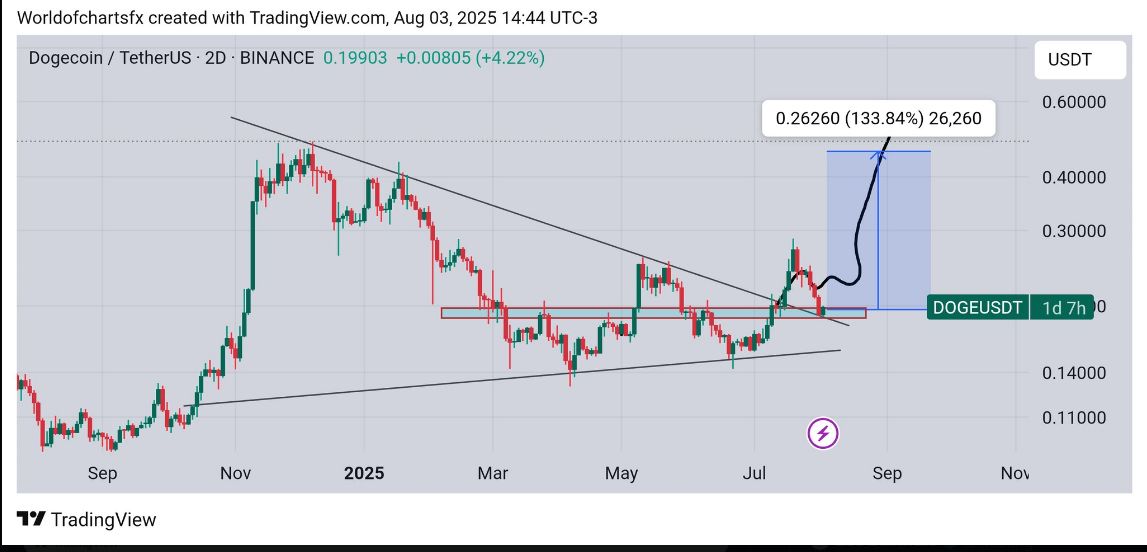
Over the last several weeks, DOGE has broken out from a prolonged descending trendline that had been capping its price since early 2025. The breakout was accompanied by strong bullish momentum, pushing the price over 30% higher from its July lows. On the 1D and 2D charts, DOGE pierced through multiple supply zones and is now undergoing a pullback towards the breakout level near $0.19.
 Source:( X)
Notably, price has retested this zone, which previously acted as resistance during the sideways structure spanning from March through early July. This level now presents itself as a critical support region . Technical projections on the daily chart place the next target at $0.44, with a measured move suggesting a potential 108.17% increase from current levels. On the 2D chart, the expected move is shown at 133.84%, pointing toward a price objective of $0.4626.
Technical Indicators Support Short-Term Continuation
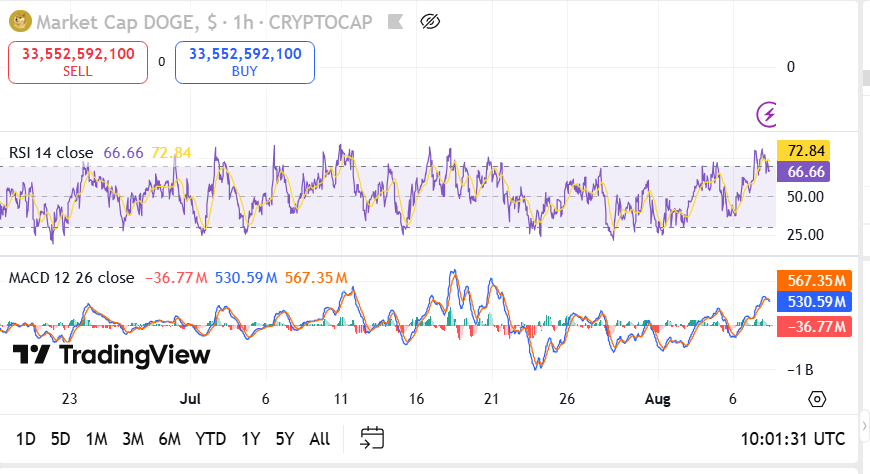
Momentum indicators further support DOGE’s attempt to maintain its bullish trajectory. On the 1-hour RSI chart, the indicator recently printed 73.49, a level that traditionally suggests strong upward momentum. The RSI is also holding above its midline at 67.17, showing sustained buying interest.
 Source: TradingView
The MACD also adds weight to this setup. The 12/26 MACD is currently positive, with the MACD line (577.09M) trading above the signal line (555.3M), reflecting bullish crossover behavior. Despite a slight histogram contraction, the positive divergence remains intact, and volume has remained relatively stable. This alignment suggests the trend may continue if price holds above the confirmed support level.
DOGE Holds Above Trendline Within Key Accumulation Zone
DOGE’s structure shows signs of a broader accumulation base forming between $0.14 and $0.21, further validated by the current price behavior. The break above the descending resistance, followed by a successful retest, is key to preserving this structure. Price action continues to align with bullish technical setups seen earlier in November 2024.