Bitget App
Trade smarter
Buy cryptoMarketsTradeFuturesEarnAISquareMore
Render (RENDER) Soars Higher While Tracing a Familiar Pattern – What Could Come Next?

Render (RENDER) Soars Higher While Tracing a Familiar Pattern – What Could Come Next?

CoinsProbeCoinsProbe2025/08/08 16:50
By:Nilesh Hembade

Date: Fri, Aug 08, 2025 | 02:06 PM GMT

The cryptocurrency market is once again buzzing with bullish sentiment as Ethereum (ETH) reclaims the $3,975 level — a price not seen since late 2024. This 3% daily surge has ignited momentum across altcoins , including Render (RENDER), which is showing signs of life after lagging in previous weeks.

RENDER has turned green with an 4% daily jump, extending its monthly gains to over 19%. However, its current chart structure reveals a familiar price behavior, which may offer clues about its next move.

Render (RENDER) Soars Higher While Tracing a Familiar Pattern – What Could Come Next? image 0 Source: Coinmarketcap

Familiar Pattern Hints at Potential Pullback

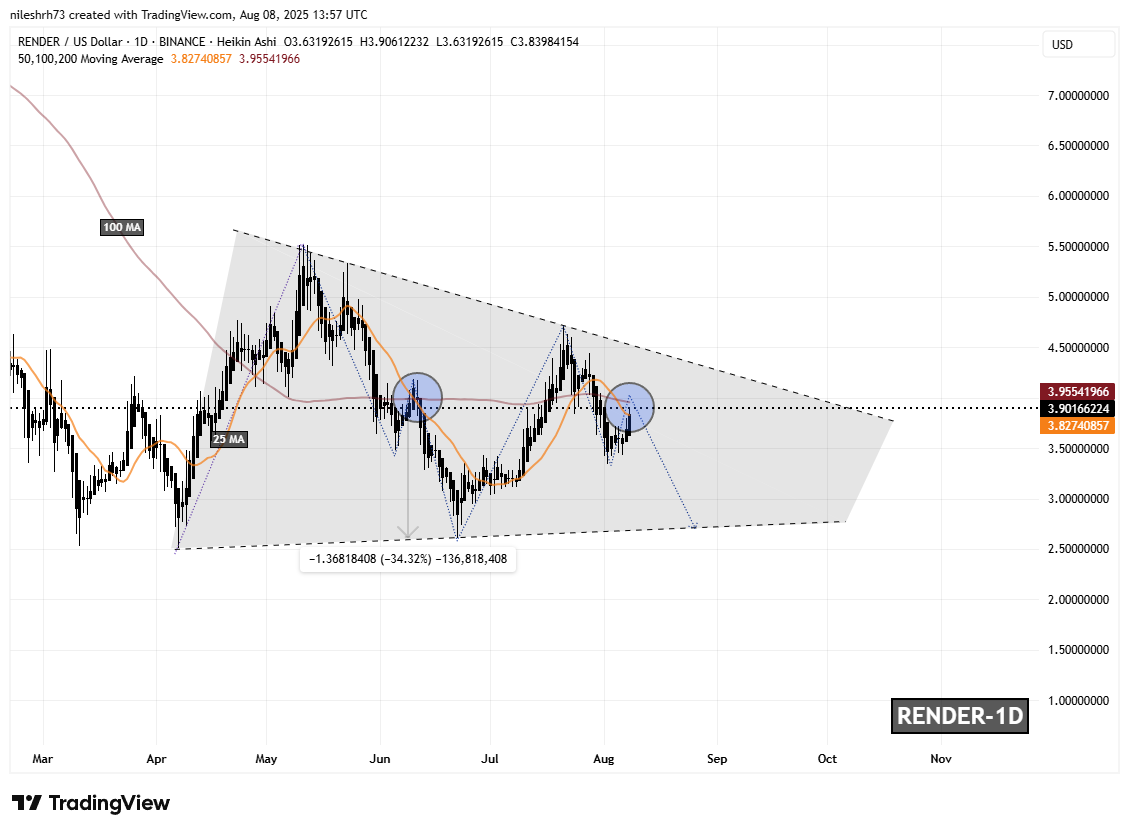
Looking at the daily chart, RENDER appears to be moving inside a falling wedge pattern — typically a bullish structure in the longer term. However, in the short term, a more cautionary signal is emerging through a repeating fractal pattern.

Back in early June, RENDER made a bearish moving average (MA) crossover, highlighted by a blue circle. At that time, price failed to hold support above the 100-day and 25-day moving averages, triggering a steep 34% drop to the lower wedge support near $2.75.

Now, the price is showing eerily similar behavior.
Render (RENDER) Soars Higher While Tracing a Familiar Pattern – What Could Come Next? image 1 Render (RENDER) Daily Chart/Coinsprobe (Source: Tradingview)

Once again, RENDER is hovering just below the 25-day and 100-day MAs, following a second bearish crossover — marked by another blue circle — hinting at a potential repeat of the previous decline.

What’s Next for RENDER?

If this fractal continues to mirror the past, RENDER could still push slightly higher toward the 100-day MA, currently near $4.10, before facing a potential breakdown. A decisive rejection and close below this zone could act as the catalyst for another correction, possibly sending the price back toward the lower wedge trendline around $2.70 — a drop of approximately 30% from current levels.

However, there’s still hope for bulls. If RENDER manages to hold above the 100-day MA and breaks out of the wedge to the upside, it would invalidate the bearish setup and open the door for a larger upward move.
0
0

Disclaimer: The content of this article solely reflects the author's opinion and does not represent the platform in any capacity. This article is not intended to serve as a reference for making investment decisions.

Understand the market, then trade.
Bitget offers one-stop trading for cryptocurrencies, stocks, and gold.
Trade now!

You may also like

Goldman Sachs Hedge Fund Chief: "Zero-Day Options" Suppress U.S. Stock Volatility, Technology and Energy Remain the Best Choices

The S&P 500 has experienced intraday fluctuations of less than 1% for 27 consecutive trading days, marking the longest period of low volatility since the pandemic. Goldman Sachs warns that this "calm" is the result of zero-day options strategies forcibly locking in the market, and once a catalyst emerges, the compressed volatility energy will be released all at once. Meanwhile, expectations for a rate hike in September are rising, market sentiment has dropped to its lowest point of the year, and fiscal sustainability risks loom large—is this pot of heating water going to boil for much longer?

华尔街见闻2026/09/15 03:56

Is a new wave of sell-offs approaching? The ultimate rival of the AI bull market emerges—The "global anchor of asset pricing" breaks through the 5% super threshold

After the 10-year US Treasury yield breaks back above the critical 5% mark, it is more likely to usher in a period of high-level tug-of-war and accelerated asset differentiation. Especially before energy shocks and the significantly eased large-scale expansion of the US fiscal deficit, the conditions to quickly replicate the sharp yield decline seen at the end of 2023 are not yet fully in place.

智通财经2026/09/15 03:26
Is a new wave of sell-offs approaching? The ultimate rival of the AI bull market emerges—The "global anchor of asset pricing" breaks through the 5% super threshold