

XRP is showing early signs of a potential bull run, trading above key support levels. Bitcoin has breached $115,000, while Solana may be gearing up for volatility.
-
XRP’s price is currently at $3.07, needing to surpass $3.30 for a confirmed bull run.
-
Bitcoin has broken the $115,000 resistance but faces challenges at $120,000.
-
Solana’s tight EMA compression suggests a possible surge similar to its October 2024 rally.
Explore the latest crypto trends as XRP hints at bullish momentum, Bitcoin tests key levels, and Solana prepares for potential volatility.
What is the Current Status of XRP?
XRP is currently trading at about $3.07, showing resilience after recovering from a low of $2.80. To confirm a bull run, XRP must surpass $3.30, which previously acted as resistance.
How is Bitcoin Performing?
Bitcoin has officially breached the crucial resistance level of $115,000. However, it faces significant resistance at $120,000, which has historically been a ceiling. The upward trend is supported by all major moving averages, but caution is advised.
Frequently Asked Questions
What are the key support levels for XRP?
XRP’s key support levels are currently at $2.80 and $2.60, which correspond to the 50 and 100 EMAs, respectively.
How does Bitcoin’s resistance affect its price movement?
Bitcoin’s resistance at $120,000 has historically led to price rejections, making it crucial for traders to monitor this level closely.
Key Takeaways
- XRP is showing bullish signs: Trading above $3.07 with a need to surpass $3.30.
- Bitcoin’s resistance is critical: Watch for movements around $120,000.
- Solana’s volatility potential: EMA compression suggests a possible breakout.
Conclusion
In summary, XRP is on the verge of a potential bull run, while Bitcoin and Solana are navigating critical resistance levels. Traders should remain vigilant and monitor these key price points for future movements.
-
Bitcoin Gets Ready
-
Solana Squeezed Too Hard
XRP painting early signs of a possible bull run; investors should exercise caution as there is currently insufficient confirmation. Right now, the asset is above the 26 EMA, a crucial short-term support level that frequently denotes bullish momentum. A sustained upward trend or a complete market reversal are not, however, assured by a single indicator.
XRP has shown resilience in recent weeks, recovering from a steep correction from the $3.60 range to a local low near $2.80. Buying activity around the 50 EMA was strong, supporting this rebound and suggesting that mid-term bulls are still active. At the moment, XRP is trading at about $3.07, a level that requires careful attention.
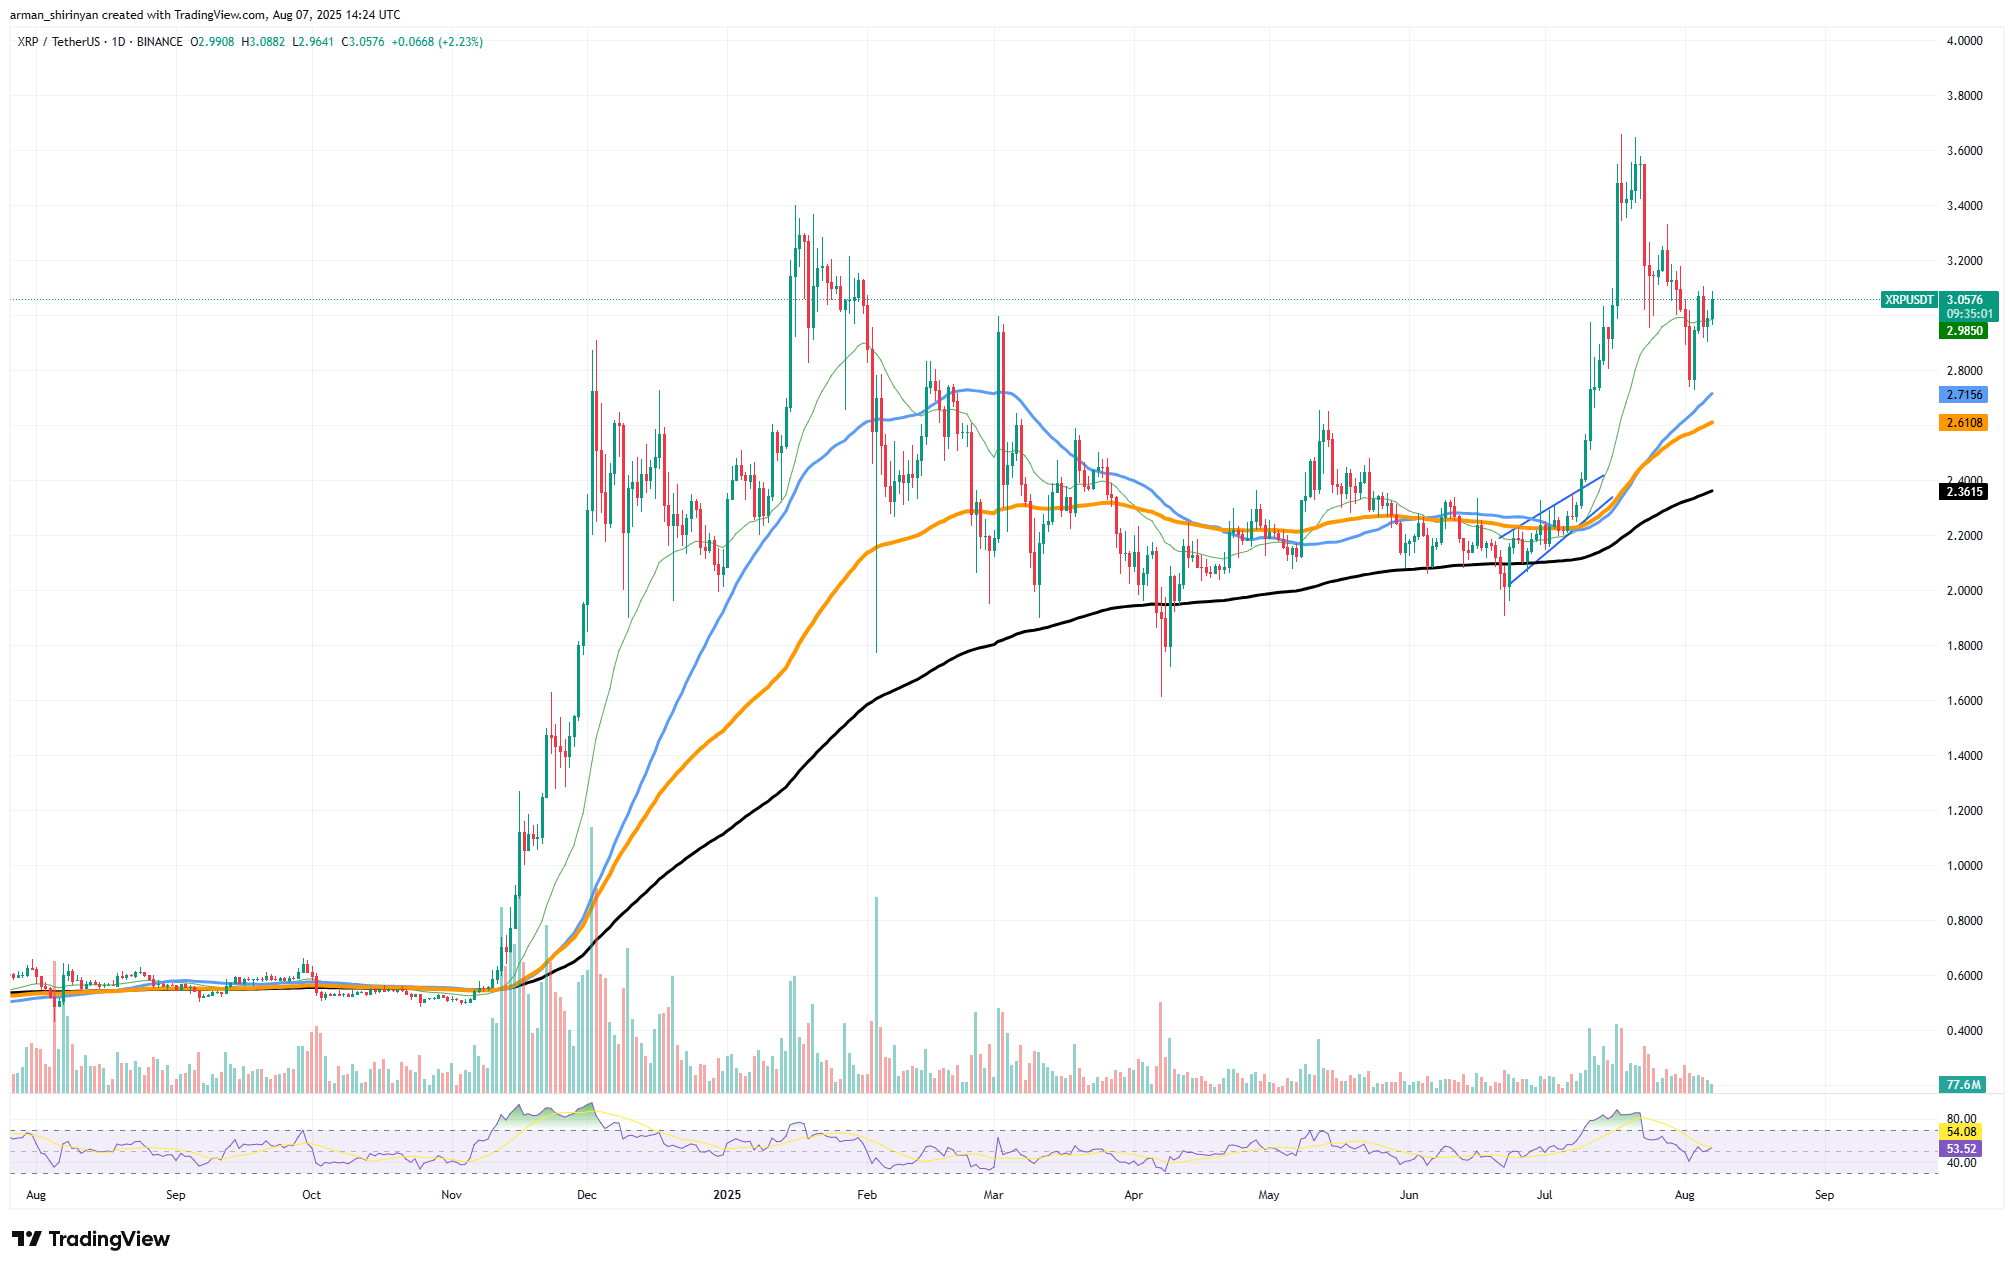 XRP/USDT Chart by TradingView
In order to confirm a proper bull run, XRP needs to surpass and stay above $3.30, which served as local resistance during the previous decline. If it breaks above that level, it may be possible to retest the 2025 high, which is still about 25% off at $3.80. Support levels on the downside are $2.80 and $2.60, which correspond to the 50 and 100 EMAs, respectively.
If these levels were to fall, it would indicate waning bullish momentum and potential further decline. Compared to July’s explosive move, volume is still low for the time being, indicating that momentum may not be strong enough to support a significant breakout just yet. Near 54, the RSI is in a largely neutral zone that allows for potential upside but provides no indication of strength.
Bitcoin Gets Ready
Bitcoin has officially breached the crucial resistance level of $115,000, indicating a technically confirmed breakout; however, prudence is advised. Although the breakout appears bullish on paper, the asset is once again getting close to the technically and psychologically dense resistance level of $120,000, which has served as a ceiling on several occasions in recent months.
All three of the major moving averages, the 26 EMA, 50 EMA, and 100 EMA, slope upward and are stacked in a bullish formation, indicating a clear upward structure on the chart. But since early July, Bitcoin has struggled to maintain momentum above $120,000, even with this structurally sound setup.
At that level, several rejection wicks show that sellers are trying to push through. On this most recent leg up, volume has not increased much, which may indicate that buyers are hesitating as the asset approaches overbought conditions. On its own, the RSI’s neutral 52 position provides little conviction but allows for potential movement in either direction. Until a powerful catalyst appears, range-bound movement between $112,000 and $120,000 is the most likely short-term scenario given the current structure of the market.
At $110,000, the 50 EMA served as support during earlier pulldowns, and bears might try to drive the price back down toward it. The next stronghold is at $102,500, close to the 100 EMA if that level breaks.
Solana Squeezed Too Hard
Solana is exhibiting compression that may be a precursor to another surge in volatility, perhaps akin to the October 2024 rally of 84%. The cluster of exponential moving averages (26 EMA, 50 EMA, and 100 EMA) that all converge closely around the $162-$165 region has caused SOL to bounce off and is currently trading at about $172.
The late October 2024 setup in which SOL coiled above the 50 EMA and exploded to the upside, gaining over 84 percent in a brief period of time before reversing, is similar to this tight EMA compression. As the price tries to recover its prior support trendline, which is currently serving as resistance after dropping below it during the most recent correction from the $200+ level, momentum is currently regaining.
The RSI indicates that there is still potential for upward momentum without immediately causing selling pressure because it is currently trading just below the overbought zone. The volume profile has been muted during the recent bounce, indicating accumulation rather than distribution, which adds interest to this setup.
A sharp increase in trading volume once the breakout starts could occur if this pattern recurs. It is imperative to remember that past performance does not necessarily indicate future actions. Although historically the EMA squeeze has resulted in volatility breakouts, direction is important, and if the $180 level is not regained, a retest of $162 or lower may occur.


