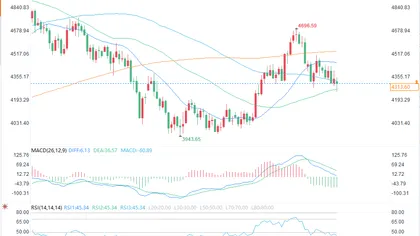
Ethereum (ETH) is currently retesting a crucial resistance zone near $4,000, with selling pressure reaching historic levels, suggesting a potential decline of 25%-35%.
-
ETH Net Taker Volume hit -$418.8 million, marking the second-largest daily sell imbalance ever.
-
Price is testing a significant resistance zone near $4,000, reminiscent of the December 2024 peak.
-
ETH could experience a drop of 25%–35% towards key trendlines by September.
Ethereum’s selling pressure signals a potential decline as it retests significant resistance levels, with key metrics indicating a bearish outlook.
Traders Sell 115,400 More ETH Than They Buy
As of Tuesday, ETH’s Net Taker Volume dropped to -$418.8 million, the second-largest daily outflow ever, with 115,400 more ETH sold than bought via market orders, according to CryptoQuant data.
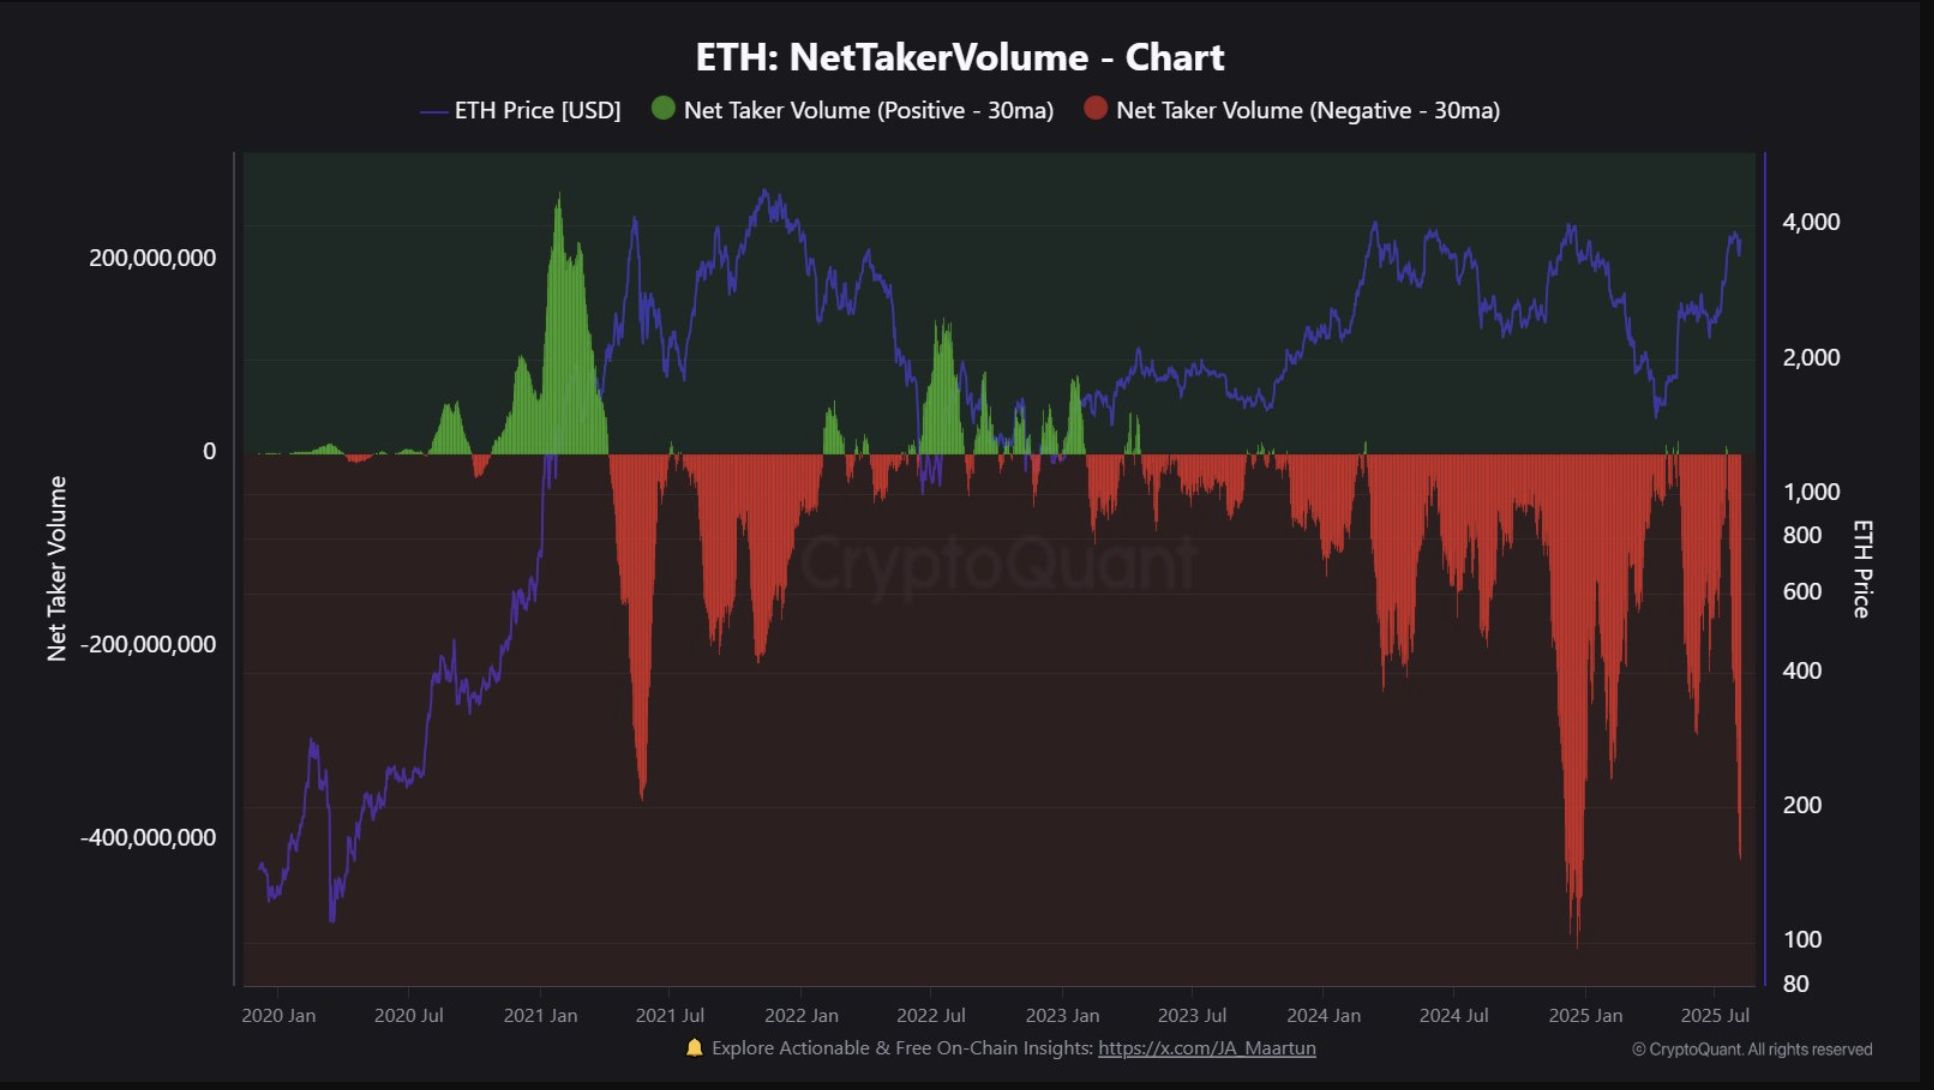 ETH Net Taker Volume chart vs price. Source: CryptoQuant
Net Taker Volume tracks the difference between buying and selling executed through market orders. These “taker” trades prioritize execution speed over price, typically indicating urgency or fear. When taker sells volume vastly outweighs taker buys, it often suggests capitulation or heavy profit-taking.
Such massive sell-side imbalances have historically marked local tops,” wrote CryptoQuant analyst Maartunn, casting doubt on the sustainability of Ethereum’s current rally.
Ether May Decline 25%-35% Next
The latest surge in ETH sell-side pressure came as the price tests a historically significant distribution zone between $3,600 and $4,000, a level that has repeatedly acted as resistance since 2021.
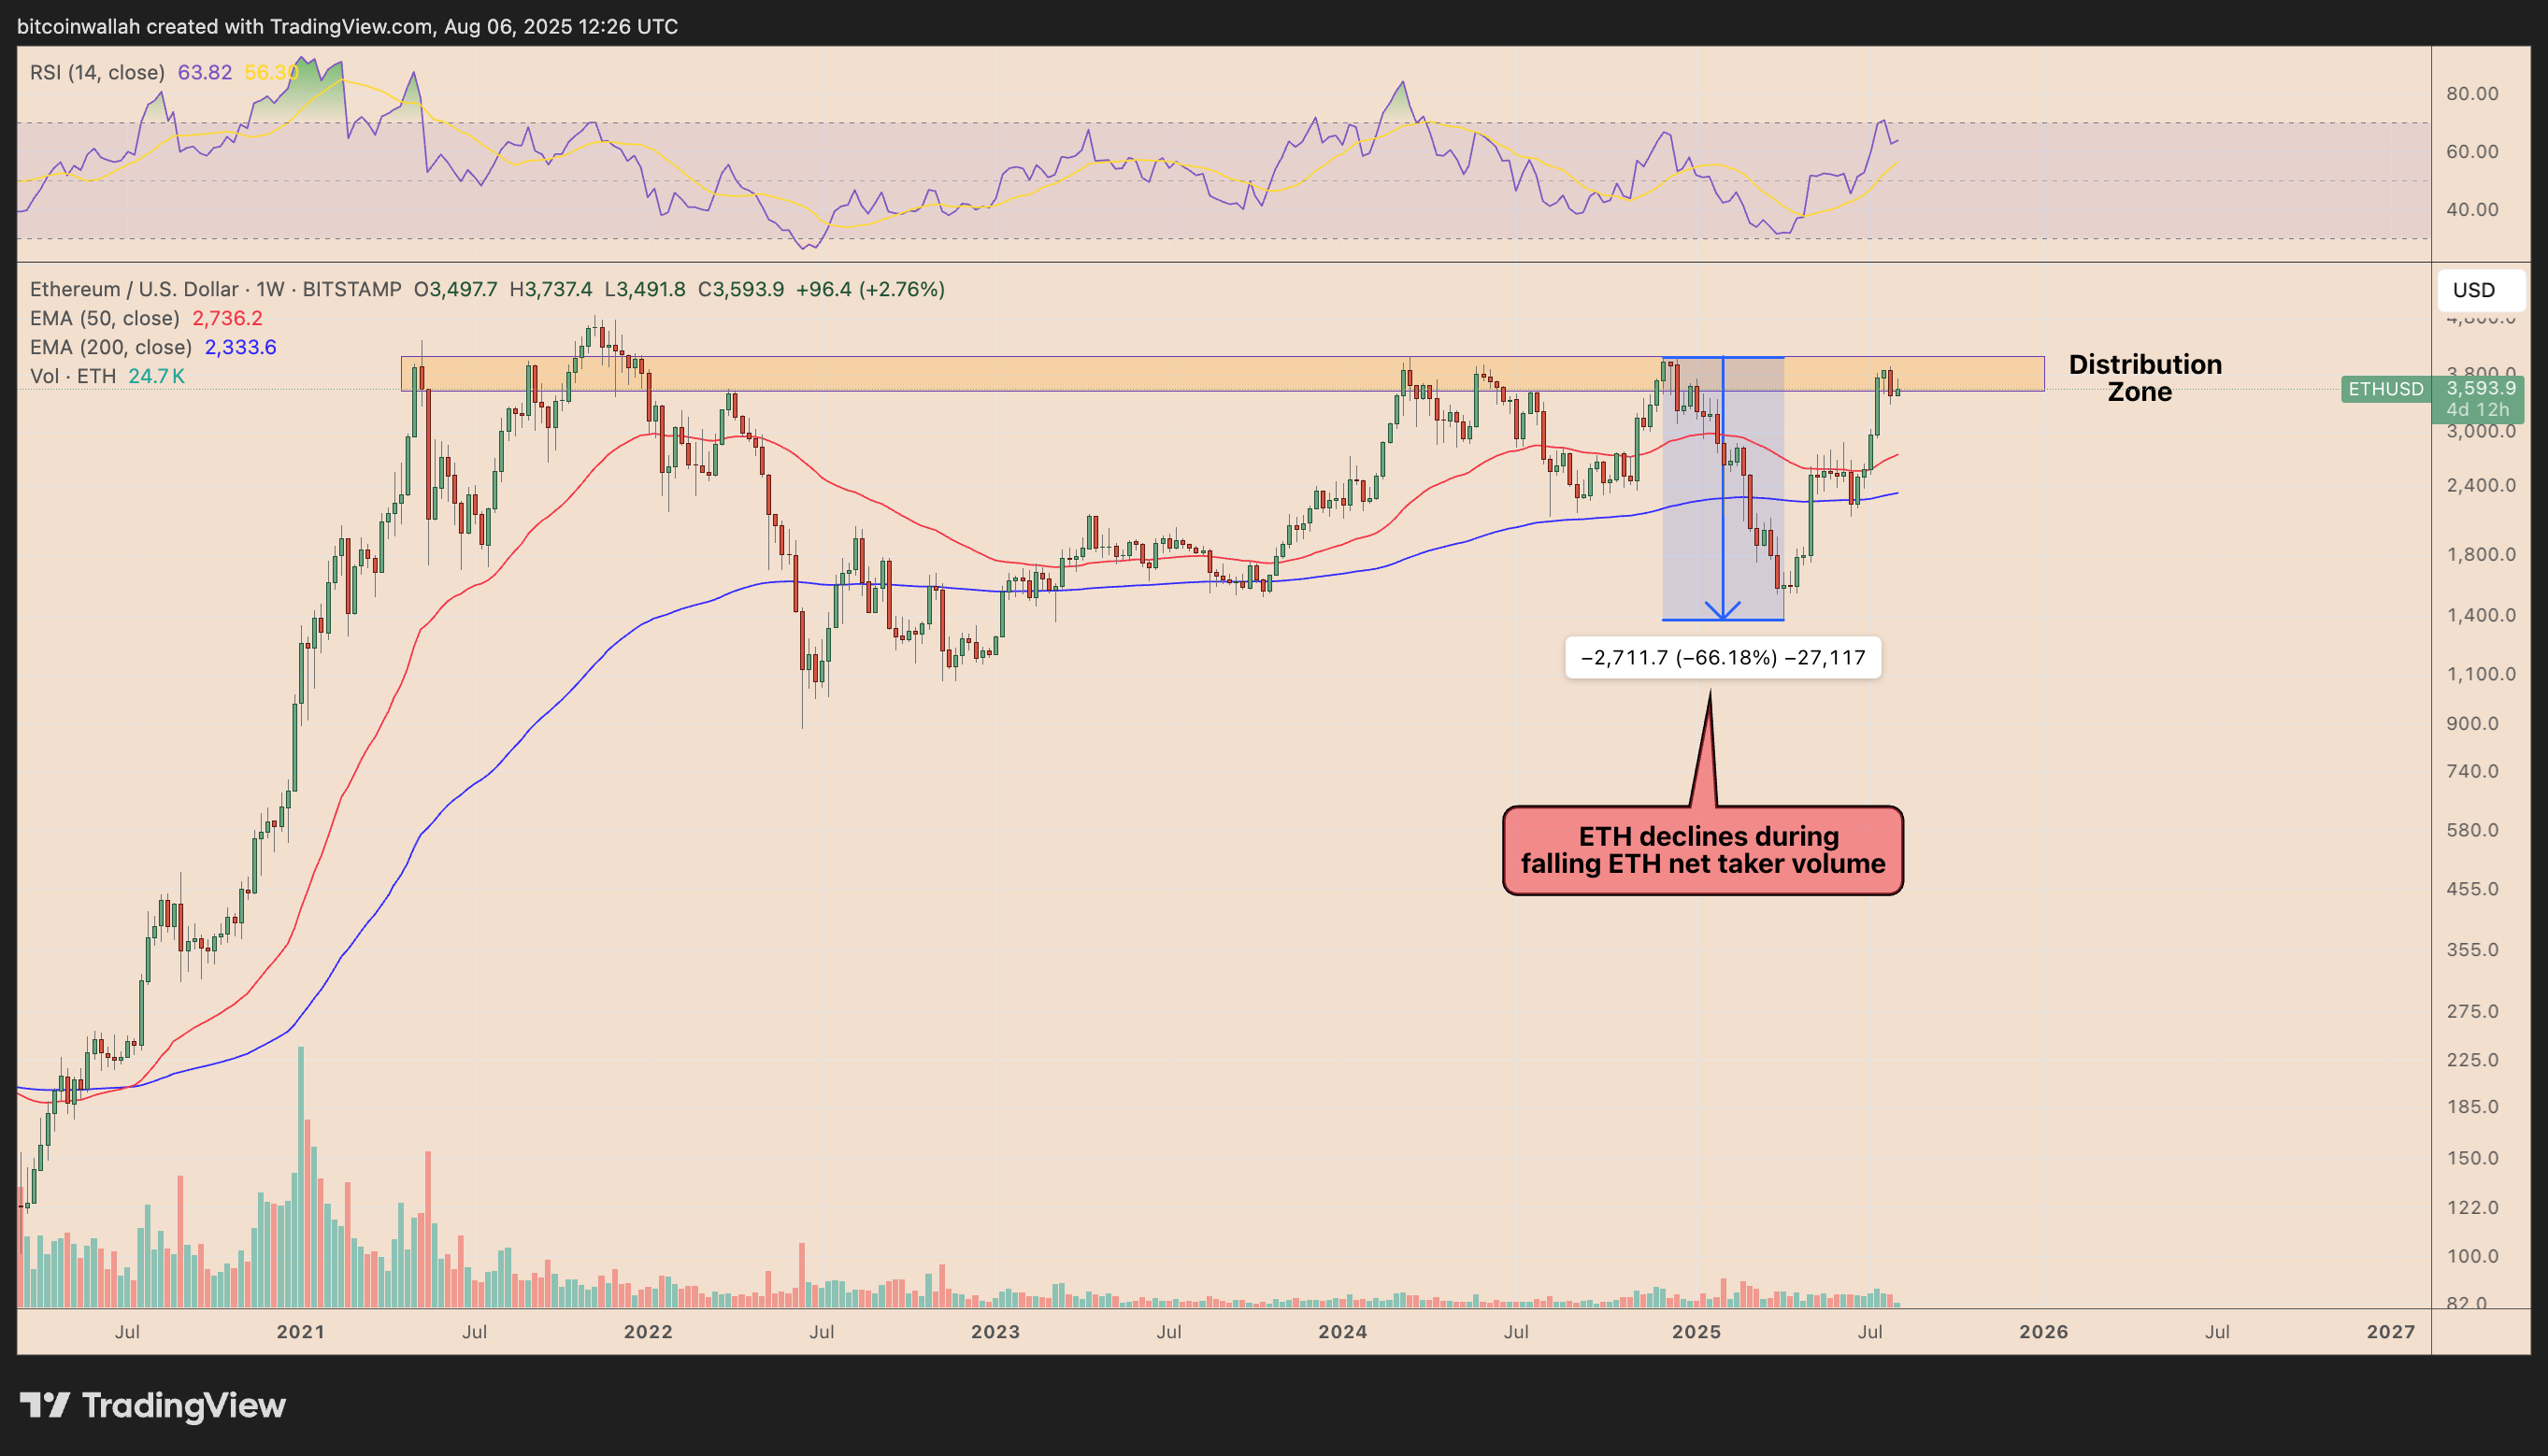 ETH/USD weekly price chart. Source: TradingView
Ethereum faced a similar setup in December 2024. At the time, the Net Taker Volume turned sharply negative, and ETH also traded near this same resistance zone.
What followed was a steep 66% decline, with the price collapsing toward its 50-week (the red wave) and 200-week (the blue wave) exponential moving averages (EMA).
A similar outcome may unfold, with ETH retesting the $3,600–$4,000 resistance, Net Taker Volume plunging, and weekly relative strength index (RSI) cooling from overbought.
The confluence of bearish signals increases the probability of ETH retreating toward its 50-week and 200-week EMAs — currently at $2,736 and $2,333, respectively — by September or October, similar to the decline seen in late 2024.
A drop to these support levels would mark a 25%–35% decline from current prices.
Frequently Asked Questions
What is Net Taker Volume?
Net Taker Volume measures the difference between buying and selling executed through market orders, indicating market sentiment and urgency.
How does selling pressure affect Ethereum’s price?
Increased selling pressure often leads to price declines, especially when it indicates capitulation or heavy profit-taking among traders.
Key Takeaways
- ETH’s Net Taker Volume is at historic lows: Signaling potential local tops and increased selling pressure.
- Resistance near $4,000: A critical level that has historically led to significant price declines.
- Potential for a 25%-35% decline: As ETH retests key trendlines, bearish signals suggest a possible drop.
Conclusion
Ethereum’s current market dynamics indicate a precarious position as it retests significant resistance levels. With selling pressure reaching historic extremes, traders should remain vigilant for potential declines in the coming months.