Bitget App
Trade smarter
Buy cryptoMarketsTradeFuturesEarnAISquareMore
Bearish Breakdown, Bullish Hope: What’s Next for FET After the Fall?

Bearish Breakdown, Bullish Hope: What’s Next for FET After the Fall?

CryptonewslandCryptonewsland2025/08/05 04:55
By:by Francis E
  • FET’s six-month triangle broke down near $0.66, flipping sentiment bearish as traders eye deeper Fibonacci support around $0.56 to $0.49.
  • Despite the recent dip, FET still respects its macro trendline from 2022,but a close below $0.60 could flip the long-term script.
  • Elliott Wave analysis warns of a wave C extension, with the $0.49 zone flashing red as a likely landing spot if bulls stay sidelined.


FET’s recent price action signals a clear shift in momentum after a critical breakdown from a symmetrical triangle. Once a bullish consolidation zone, the pattern’s failure now points to downside continuation. The token has dipped to around $0.6239, extending a 7-day slide of more than 15%. 

Triangle Breakdown Shakes Bulls’ Confidence

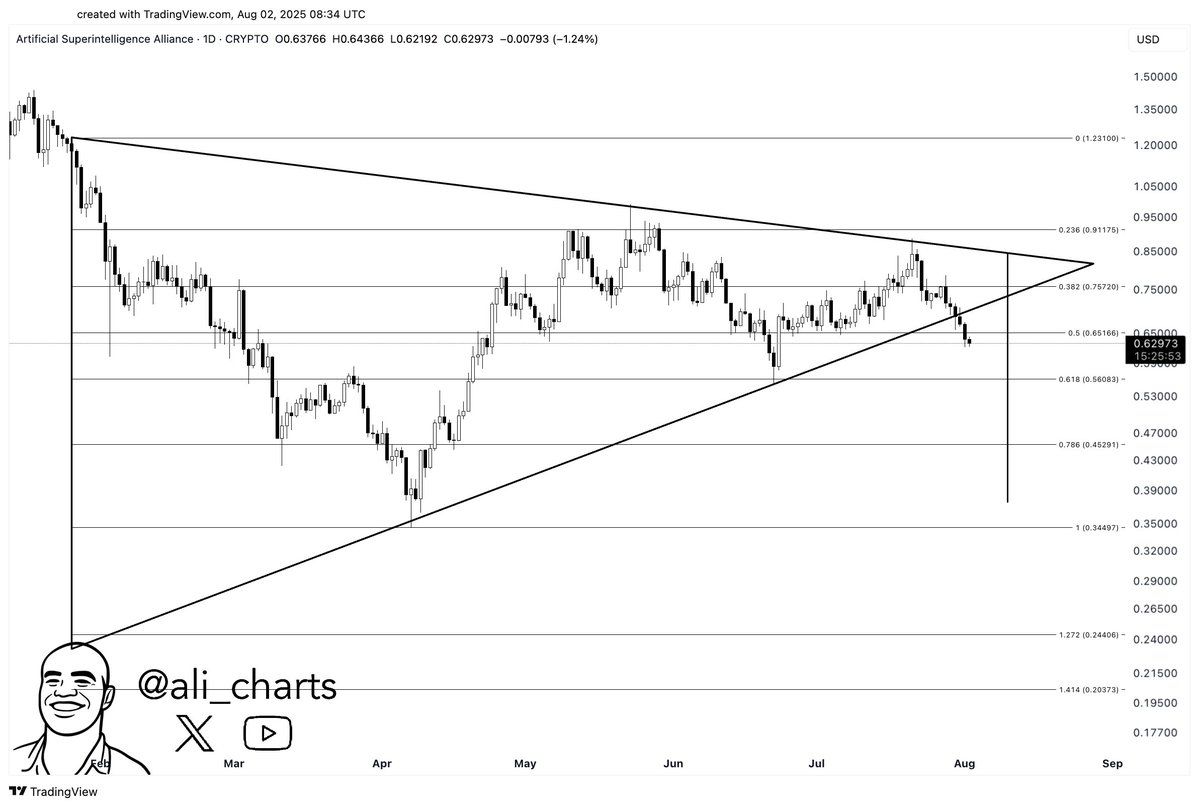
As  highlighted by Ali Charts , the daily FET chart shows a decisive break from a symmetrical triangle pattern that formed over six months. The structure, bounded by a rising support line and descending resistance, held since February but failed to sustain in late July.
Bearish Breakdown, Bullish Hope: What’s Next for FET After the Fall? image 0 Bearish Breakdown, Bullish Hope: What’s Next for FET After the Fall? image 1 Source: ali_charts

After losing the 0.5 Fibonacci retracement at $0.66166, FET dropped toward $0.62973 with a 1.24% daily decline.The triangle’s measured move now points to potential levels well below $0.34497, based on the height from apex to support.

The next major  support sits around $0.56, on the 0.618 Fibonacci  level. If it fails ,buyers could step in between $0.45 and $0.34 where price has bounced before during past dips.

Macro Structure Still Holds—but Barely

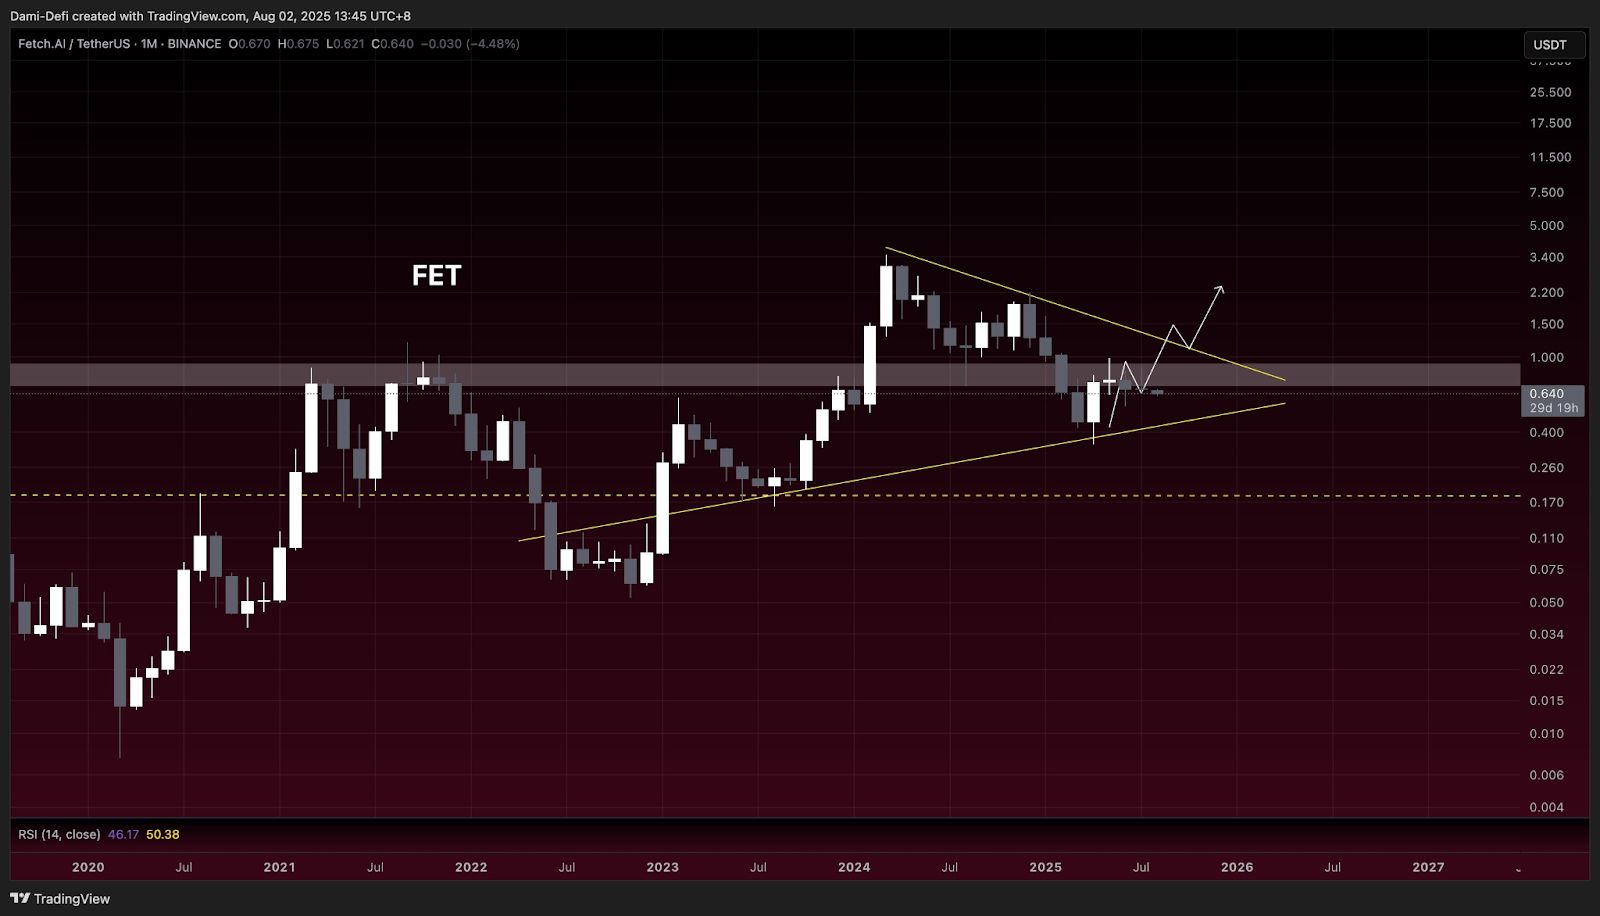
X user Dami-Defi shared a long-term monthly chart, showing a macro triangle from the 2021 peak and 2022 base. The price currently trades near the lower boundary of that structure. Despite the recent bearish move, FET continues to respect higher lows that have persisted since early 2022.
Bearish Breakdown, Bullish Hope: What’s Next for FET After the Fall? image 2 Bearish Breakdown, Bullish Hope: What’s Next for FET After the Fall? image 3 Source: DamiDefi

Resistance near $0.95–$1.10 has capped upside attempts since late 2023. The monthly RSI hovers between 46 and 50, showing a lack of strong momentum in either direction. As long as the structure remains intact, long-term holders may still view this as a consolidation phase.

Fibonacci and Wave Count Suggest Deeper Levels Ahead

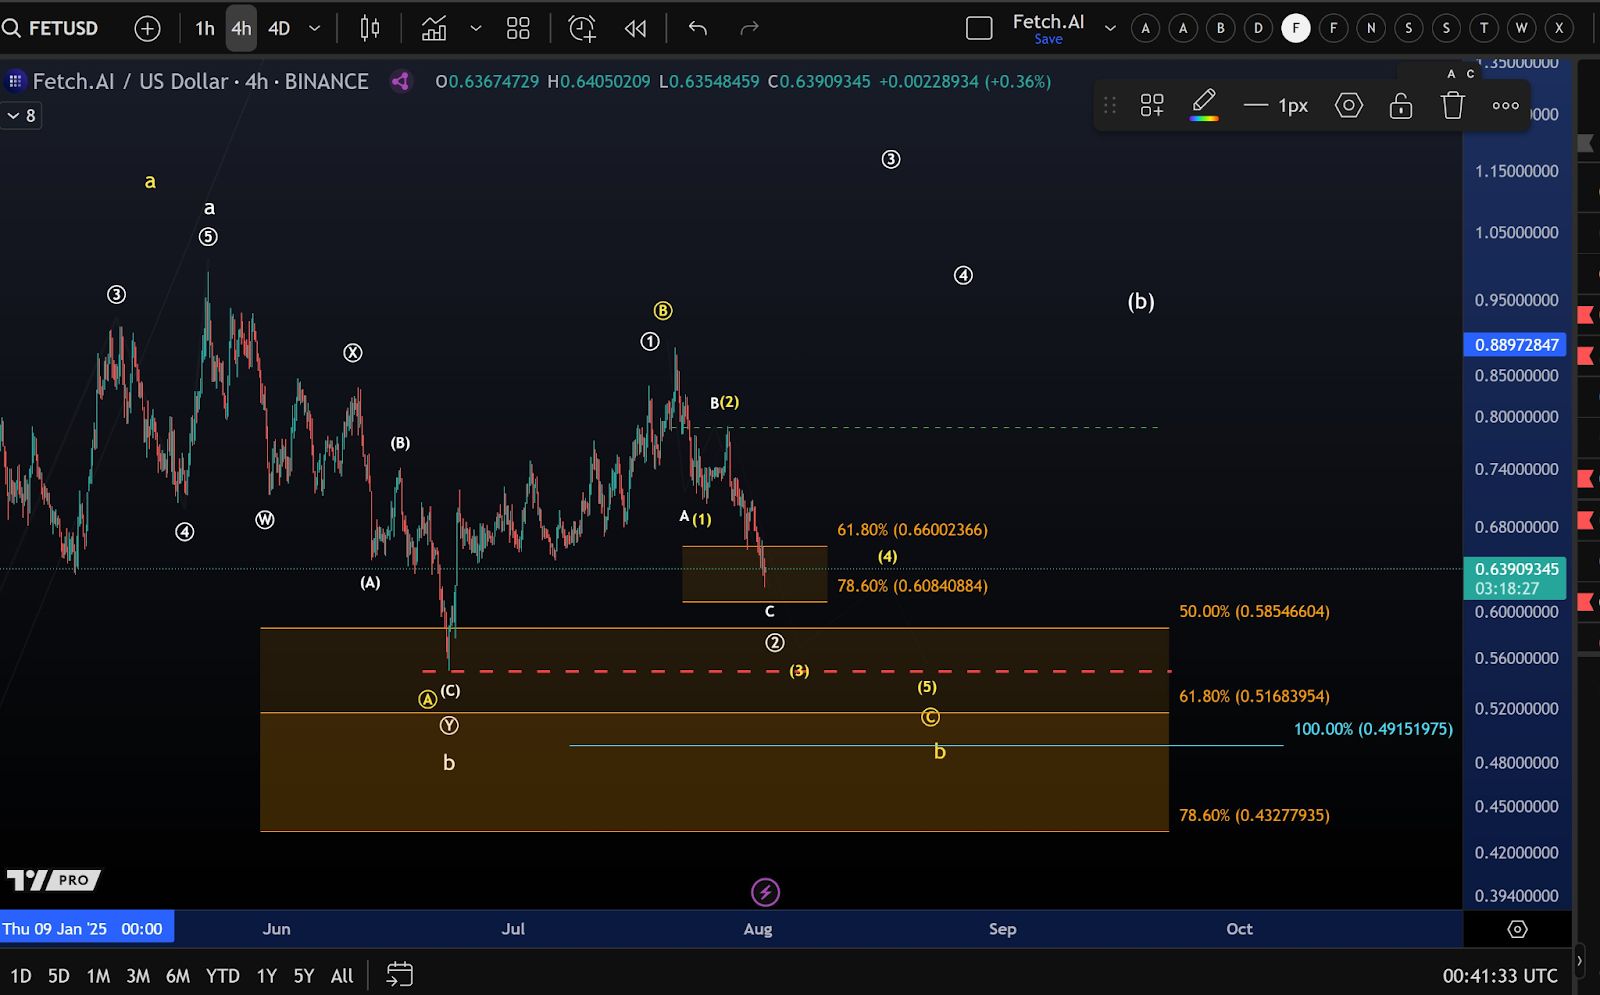
Another analyst, More Crypto Online, offered an Elliott Wave perspective using the 4-hour chart. According to the wave count, FET is nearing the end of a corrective phase, with wave C pushing into a key Fibonacci confluence zone between $0.660 and $0.608.Bearish Breakdown, Bullish Hope: What’s Next for FET After the Fall? image 4 Bearish Breakdown, Bullish Hope: What’s Next for FET After the Fall? image 5

                             Source Morecryptoonl

If this zone fails, the next likely destination lies between $0.516 and $0.49—also backed by the 100% retracement level of the wave count. This aligns with broader market weakness and the continuation of a corrective cycle that could stretch into early September.FET’s short-term outlook remains fragile, but key long-term structures still offer hope to bulls.

0
0

Disclaimer: The content of this article solely reflects the author's opinion and does not represent the platform in any capacity. This article is not intended to serve as a reference for making investment decisions.

Understand the market, then trade.
Bitget offers one-stop trading for cryptocurrencies, stocks, and gold.
Trade now!

You may also like

US and European interest rate trends may diverge! Citadel Securities: Energy shocks and high interest rates may increase downward pressure on the European economy

Castle Securities believes that although energy price shocks and the tightening of monetary policy by the European Central Bank have driven European bond yields to continue rising, these two forces may ultimately also act as factors limiting further increases in yields.

智通财经2026/09/14 22:36
US and European interest rate trends may diverge! Citadel Securities: Energy shocks and high interest rates may increase downward pressure on the European economy

Bank of America (BAC.US) once plunged 6% as CEO sends cautious signal: Q3 trading revenue expected to be flat year-over-year, investment banking fee income may fall short of expectations

Bank of America CEO Brian Moynihan stated that the bank's trading revenue for the third quarter is expected to be "roughly flat" compared to the same period last year, indicating that after strong growth in the first half of the year, the growth momentum of Wall Street trading businesses is slowing down.

智通财经2026/09/14 22:31
Bank of America (BAC.US) once plunged 6% as CEO sends cautious signal: Q3 trading revenue expected to be flat year-over-year, investment banking fee income may fall short of expectations

Overnight US Stocks | Three Major Indices Closed Lower, AI Giants Jointly Call for Slowing Development, Concept Stocks Plunge Across the Board

At the close, the Dow Jones Industrial Average fell by 152.01 points, or 0.29%, to 52,421.28 points; the S&P 500 Index dropped by 37.03 points, or 0.48%, to 7,619.95 points; and the Nasdaq Composite Index declined by 146.62 points, or 0.56%, to 26,186.41 points.

智通财经2026/09/14 22:26
Overnight US Stocks | Three Major Indices Closed Lower, AI Giants Jointly Call for Slowing Development, Concept Stocks Plunge Across the Board