Ethereum is currently mirroring its 2016 rally pattern by holding strong support at $3,400, with analysts targeting a rise to $4,200 driven by significant on-chain accumulation and bullish momentum.
-
Ethereum’s price structure closely resembles its 2016–2017 rally, indicating a potential continuation toward $4,200.
-
More than 1 million ETH withdrawn from exchanges signals strong accumulation and investor confidence.
-
RSI near oversold and steady $20 billion trading volume support ongoing bullish momentum above $3,400.
Ethereum price follows 2016 rally pattern with strong accumulation; analysts eye $4,200 target. Stay updated with COINOTAG for expert crypto insights.
How Ethereum’s Price Action Aligns With Its Previous Cycle Movement
Ethereum’s current price action mirrors the 2016–2017 rally cycle, showing similar phases of accumulation, correction, and momentum buildup. This pattern suggests a possible continuation of the bullish trend toward $4,200. At the time of writing, ETH trades at $3,558, maintaining key support levels.
What Does the Historical Comparison Reveal About Ethereum’s Market Behavior?
A detailed comparison of the 2024–2026 and 2016–2017 monthly charts reveals structural similarities in price patterns. Market analyst Michael van de Poppe highlights the $3,400–$3,368 zone as critical support, fitting within a healthy bullish trend. A breakout above $4,000 could trigger further gains, echoing the strong upward phase seen in the previous cycle.

$ETH is setting up just like in it did in 2016/2017.
If history repeats…
A massive pump is imminent! pic.twitter.com/7J4yZ8988z
— Mister Crypto (@misterrcrypto) August 3, 2025
Ethereum’s recent breakout above the $4,000 resistance on the 4-hour chart followed by a slight retracement reflects a consolidation phase typical of strong bullish trends. This price action aligns with the historical pattern of climbing from under $10 to over $350 during the 2016–2017 cycle.
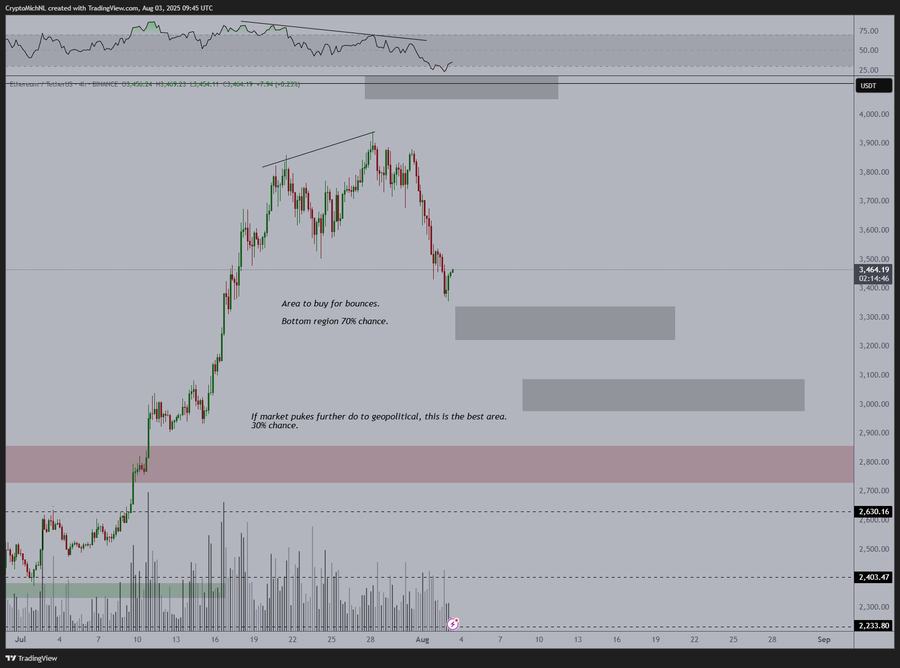 Source: MichaelVanDePoppe(X)
Why On-Chain Strength and Institutional Activity Bolster Ethereum’s Price Setup
Recent on-chain data shows over 1 million ETH withdrawn from exchanges in the last two weeks, signaling strong accumulation and long-term investor confidence. This reduction in exchange balances typically indicates a bullish phase as holders prefer to keep assets off exchanges.
How Do Volume and RSI Indicators Support Ethereum’s Bullish Momentum?
Ethereum’s trading volume remains steady around $20 billion over 24 hours, while the Relative Strength Index (RSI) nears oversold levels on the daily chart. These indicators suggest potential for price recovery and continuation of upward momentum if buying demand increases.
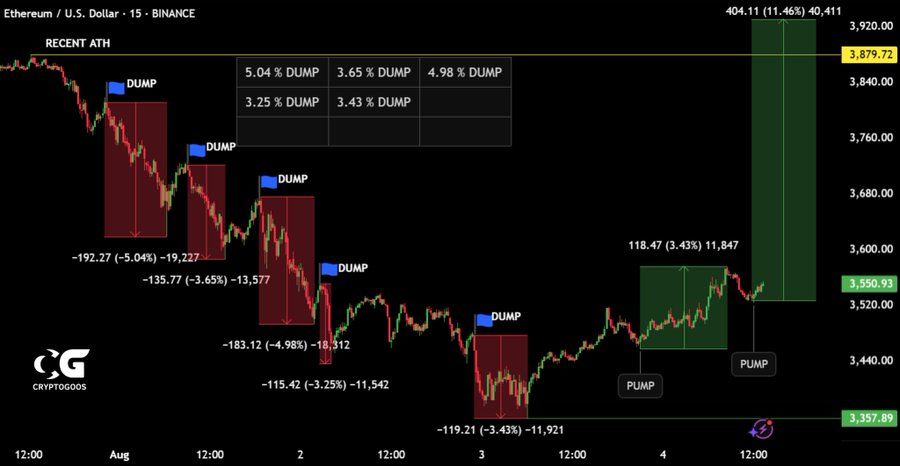 Source: CryptoGoos(X)
Crypto analyst CryptoGoos states, “ETH is in an uptrend now. Nothing stops this train,” highlighting the consistent higher-high and higher-low price formations. The strong correlation with Bitcoin, upcoming ETF inflows, and network upgrades could further fuel Ethereum’s upside potential.
Frequently Asked Questions
What is driving Ethereum’s current price rally?
Ethereum’s rally is driven by a price pattern mirroring its 2016 cycle, strong on-chain accumulation with over 1 million ETH withdrawn from exchanges, and bullish technical indicators like RSI and volume stability.
How does Ethereum’s current support level impact its future price?
Holding the $3,400 support level is crucial as it forms the base for potential upward momentum. A breakout above $4,000 could lead to a continuation toward $4,200 and beyond.
Key Takeaways
- Ethereum’s price pattern mirrors its 2016 rally: Suggesting a bullish continuation toward $4,200.
- Strong on-chain accumulation: Over 1 million ETH withdrawn from exchanges indicates investor confidence.
- Technical indicators support momentum: RSI near oversold and stable $20B volume favor price recovery.
Conclusion
Ethereum’s current market behavior strongly resembles its historic 2016 rally pattern, supported by significant on-chain accumulation and bullish technical signals. Maintaining the $3,400 support level is critical for further gains, with analysts optimistic about a move toward $4,200. Investors should monitor key breakout levels and network developments for continued momentum.