Bitget App
Trade smarter
Buy cryptoMarketsTradeFuturesStocksEarnInstitutionAI & More
INIT Surges 12.99% from Falling Wedge — Will It Hold Above the $0.436 Breakout Zone?

INIT Surges 12.99% from Falling Wedge — Will It Hold Above the $0.436 Breakout Zone?

CryptonewslandCryptonewsland2025/08/04 20:30
By:by Vee Peninah
  • INIT trades at $0.4210 with a 12.99% daily gain, approaching the $0.436 resistance level.
  • The falling wedge pattern signals tightening price action and increased trading activity, backed by a 110.66% volume surge.
  • Market cap rose to $67.96 million, while circulating supply remains at 161.43 million INIT.

INIT has gained 12.99% in the past 24 hours, rising to $0.4210, according to data from CoinMarketCap. This movement comes as the token trades within a falling wedge pattern on the 12-hour chart. Traders are closely monitoring this structure because it often indicates a potential shift in market direction if a breakout occurs. Notably, volume has surged by 110.66% to $82.1 million, reinforcing the market’s heightened activity.

$INIT Falling Wedge Formation in 12H Timeframe✅

Incase of Breakout,Expecting Massive Bullish wave📈 #INIT #INITUSDT pic.twitter.com/GUvNWy2gfP

— ZAYK Charts (@ZAYKCharts) August 4, 2025

The current price is testing the $0.436 level, which remains a critical area for near-term price action. A decisive breakout above this point may bring $0.4825 into focus as the next resistance. The falling wedge pattern has developed over several weeks , with INIT consolidating between lower highs and lower lows.

This structure has narrowed recently, placing emphasis on the upper trendline. In addition, INIT has held support levels near $0.3840, which continues to act as a base for short-term price stability.

Market Metrics Highlight Strong Trading Activity in INIT

Alongside its price action, INIT’s market cap has increased by 12.85% to $67.96 million. The circulating supply currently stands at 161.43 million tokens out of a total supply of 1 billion. 
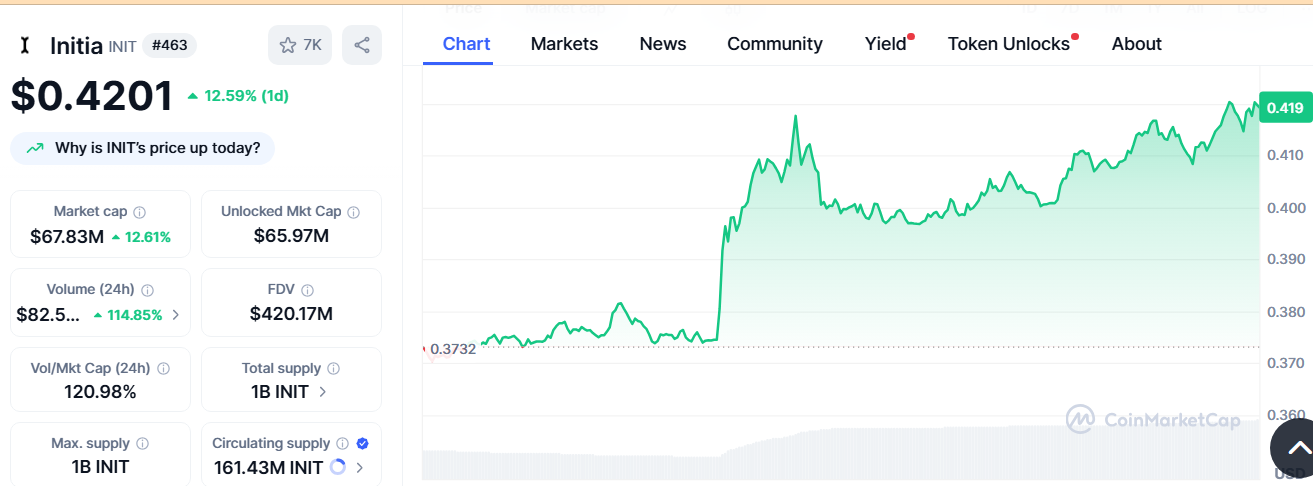
INIT Surges 12.99% from Falling Wedge — Will It Hold Above the $0.436 Breakout Zone? image 0 INIT Surges 12.99% from Falling Wedge — Will It Hold Above the $0.436 Breakout Zone? image 1 Source: CoinMarketCap

Furthermore, the token’s fully diluted valuation (FDV) has reached $420.46 million. These metrics, combined with the trading volume spike, highlight a period of notable activity. The relationship between volume and market cap now sits at 120.98%, signaling intensified trading participation.

Resistance Test and Volume Trends Shape INIT’s Next Move

Despite the recent gains, market focus remains on how INIT interacts with its resistance levels. The 12-hour chart indicates that a breakout from the wedge could potentially extend toward $0.8230, its recent high. However, this level depends on sustained momentum and whether price movement holds above short-term support. 

As trading sessions unfold, INIT’s position relative to the wedge’s trendlines will remain crucial for market participants analyzing its next steps. INIT’s price action remains centered on the falling wedge structure. Traders will closely track resistance levels and volume trends to determine whether the token sustains momentum or consolidates near current levels.


0
0

Disclaimer: The content of this article solely reflects the author's opinion and does not represent the platform in any capacity. This article is not intended to serve as a reference for making investment decisions.

Understand the market, then trade.
Bitget offers one-stop trading for cryptocurrencies, stocks, and gold.
Trade now!

You may also like

Quarterly Revenue Hits 16.8 Billion for IPO Push—Can Anthropic’s Profits Support a $2 Trillion Valuation?

Anthropic disclosed Q3 revenue of $16.8 billion and achieved adjusted profitability. Compared to OpenAI's expectations and projected massive losses in 2025, the analysis covers Anthropic's enterprise growth logic, competitive landscape, and the rationality of its $2 trillion valuation.

智通财经•2026/10/15 09:07

"Bullish" Burry Issues Another Warning for US Stocks: If the "Magnificent Seven" Join the Drop and Bond Yields Fall, Wall Street May Face a "Bloody October"

Burry warns that the painful trading in the market may continue. He proposes a bearish "Red October" scenario: if the "Magnificent Seven" U.S. tech stocks follow semiconductor stocks in a decline, and bond yields simultaneously fall, his conviction in this scenario will become even stronger.

智通财经•2026/10/15 08:46
"Bullish" Burry Issues Another Warning for US Stocks: If the "Magnificent Seven" Join the Drop and Bond Yields Fall, Wall Street May Face a "Bloody October"

Tesla (TSLA.US) to Host Roadster Launch Event This Friday: Elon Musk Promises "Greatest Product Demo Ever," Debut of the Nine-Year-Teased "Flying Sports Car"

On the eve of the Roadster launch event, Elon Musk promised to deliver "the greatest product demonstration in history."

智通财经•2026/10/15 08:37
Tesla (TSLA.US) to Host Roadster Launch Event This Friday: Elon Musk Promises "Greatest Product Demo Ever," Debut of the Nine-Year-Teased "Flying Sports Car"

Tech Stocks Plunge, Safe-Haven U.S. Treasury Trades Return? 10-Year U.S. Treasury Yield Drops to Three-Week Low

If AI capital expenditure slows down, a sudden halt in computing power construction will severely impact the supply chain while lowering market expectations for demand in electricity, commodities, and high-end hardware. This not only leads to a correction of overvalued assets, but also undermines growth expectations and inflation premiums, ultimately benefiting bonds. This logic is highly similar to the macroeconomic landscape during the bursting of the internet bubble in 2000, when the Nasdaq collapsed and the yield on 10-year US Treasury bonds dropped from a high of 6.5% to the 4% range.

华尔街见闻•2026/10/15 08:29