Bitget App
Trade smarter
Buy cryptoMarketsTradeFuturesEarnAISquareMore
Dogwifhat (WIF) To Bounce Back? Key Emerging Pattern Signaling Potential Upside Move

Dogwifhat (WIF) To Bounce Back? Key Emerging Pattern Signaling Potential Upside Move

CoinsProbeCoinsProbe2025/08/04 11:45
By:Nilesh Hembade

Date: Mon, Aug 04, 2025 | 11:30 AM GMT

The cryptocurrency market is showing signs of a mild recovery after a sharp correction, with Ethereum (ETH) rebounding to $3550 from its recent low of $3357. As momentum returns, several altcoins and memecoins are starting to show strength — including Dogwifhat (WIF).

WIF is trading back in the green today, posting modest gains. Its chart is now highlighting the emergence of a symmetrical triangle pattern, a technical structure that could be setting the stage for a potential upside move.

Dogwifhat (WIF) To Bounce Back? Key Emerging Pattern Signaling Potential Upside Move image 0 Source: Coinmarketcap

Symmetrical Triangle in Play?

On the daily timeframe, WIF is developing a classic symmetrical triangle — a pattern typically considered neutral but often leading to strong price movement once a breakout occurs. The coin recently pulled back after facing rejection near the upper boundary of the triangle around $1.32.

That rejection sent WIF sliding back to the lower trendline near $0.82, where it found support — not only at the triangle’s baseline but also from the 200-day moving average.
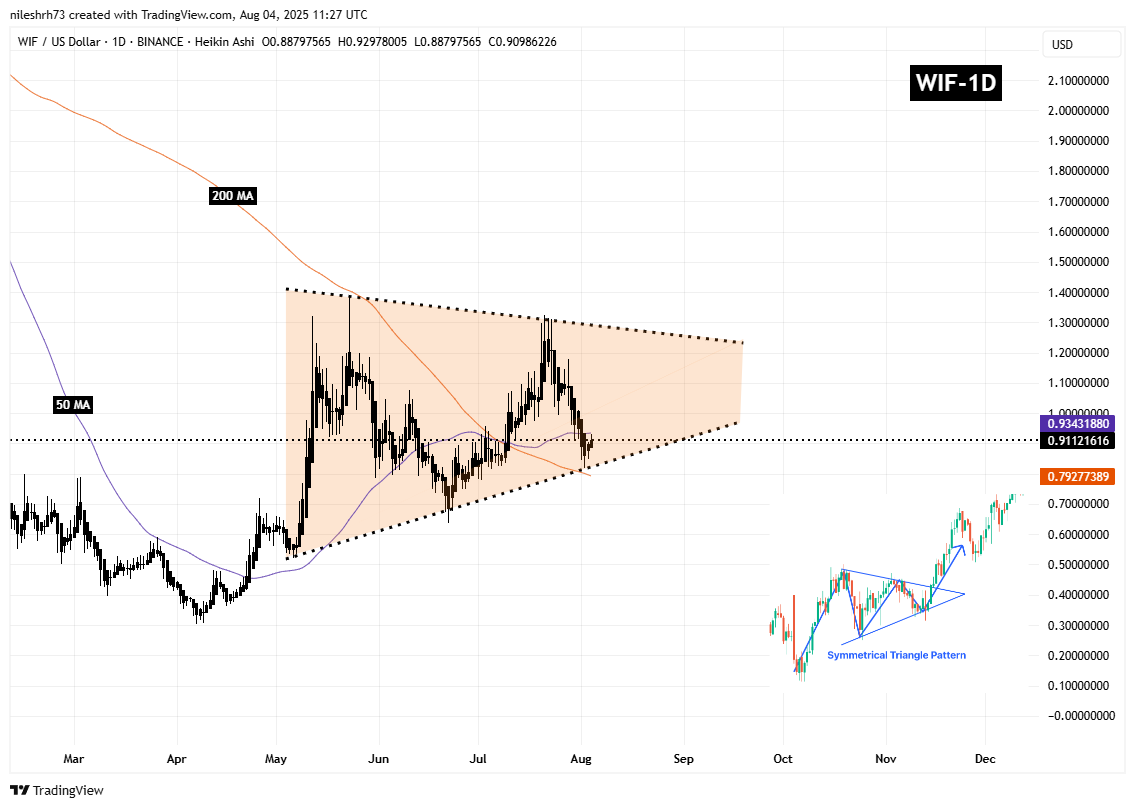
Dogwifhat (WIF) To Bounce Back? Key Emerging Pattern Signaling Potential Upside Move image 1 Dogwifhat (WIF) Daily Chart/Coinsprobe (Source: Tradingview)

This confluence of technical support helped initiate a bounce, pushing WIF back above $0.91. It is currently attempting to clear resistance at the 50-day moving average, located at $0.9343.

What’s Next for WIF?

WIF’s near-term outlook will likely hinge on how it behaves around these key technical levels. A successful breakout above the 50-day MA could trigger bullish momentum, potentially carrying the price back toward the triangle’s upper boundary near $1.24 — a move that would reflect over 36% upside from current levels.

However, for this setup to remain valid, WIF must hold its footing above the 200-day MA at $0.79. A breakdown below this level could invalidate the triangle pattern and open the door to further downside.

0
0

Disclaimer: The content of this article solely reflects the author's opinion and does not represent the platform in any capacity. This article is not intended to serve as a reference for making investment decisions.

Understand the market, then trade.
Bitget offers one-stop trading for cryptocurrencies, stocks, and gold.
Trade now!

You may also like

Bank of America (BAC.US) once plunged 6% as CEO sends cautious signal: Q3 trading revenue expected to be flat year-over-year, investment banking fee income may fall short of expectations

Bank of America CEO Brian Moynihan stated that the bank's trading revenue for the third quarter is expected to be "roughly flat" compared to the same period last year, indicating that after strong growth in the first half of the year, the growth momentum of Wall Street trading businesses is slowing down.

智通财经2026/09/14 22:31
Bank of America (BAC.US) once plunged 6% as CEO sends cautious signal: Q3 trading revenue expected to be flat year-over-year, investment banking fee income may fall short of expectations

Overnight US Stocks | Three Major Indices Closed Lower, AI Giants Jointly Call for Slowing Development, Concept Stocks Plunge Across the Board

At the close, the Dow Jones Industrial Average fell by 152.01 points, or 0.29%, to 52,421.28 points; the S&P 500 Index dropped by 37.03 points, or 0.48%, to 7,619.95 points; and the Nasdaq Composite Index declined by 146.62 points, or 0.56%, to 26,186.41 points.

智通财经2026/09/14 22:26
Overnight US Stocks | Three Major Indices Closed Lower, AI Giants Jointly Call for Slowing Development, Concept Stocks Plunge Across the Board