
HBAR Price Pattern Shows Why Traders Need to Brace for More Pain Ahead

HBAR has dropped sharply, with technical indicators signaling more downside ahead. Traders are watching for either a bounce or deeper losses.
Hedera Hashgraph’s native token HBAR has plummeted by 15% over the past week, dragged down by a broader market pullback.
As the crypto market continues to show signs of weakening momentum, technical indicators suggest HBAR’s downturn may be far from over.
HBAR Drops Under 20-Day EMA as Bears Take Over
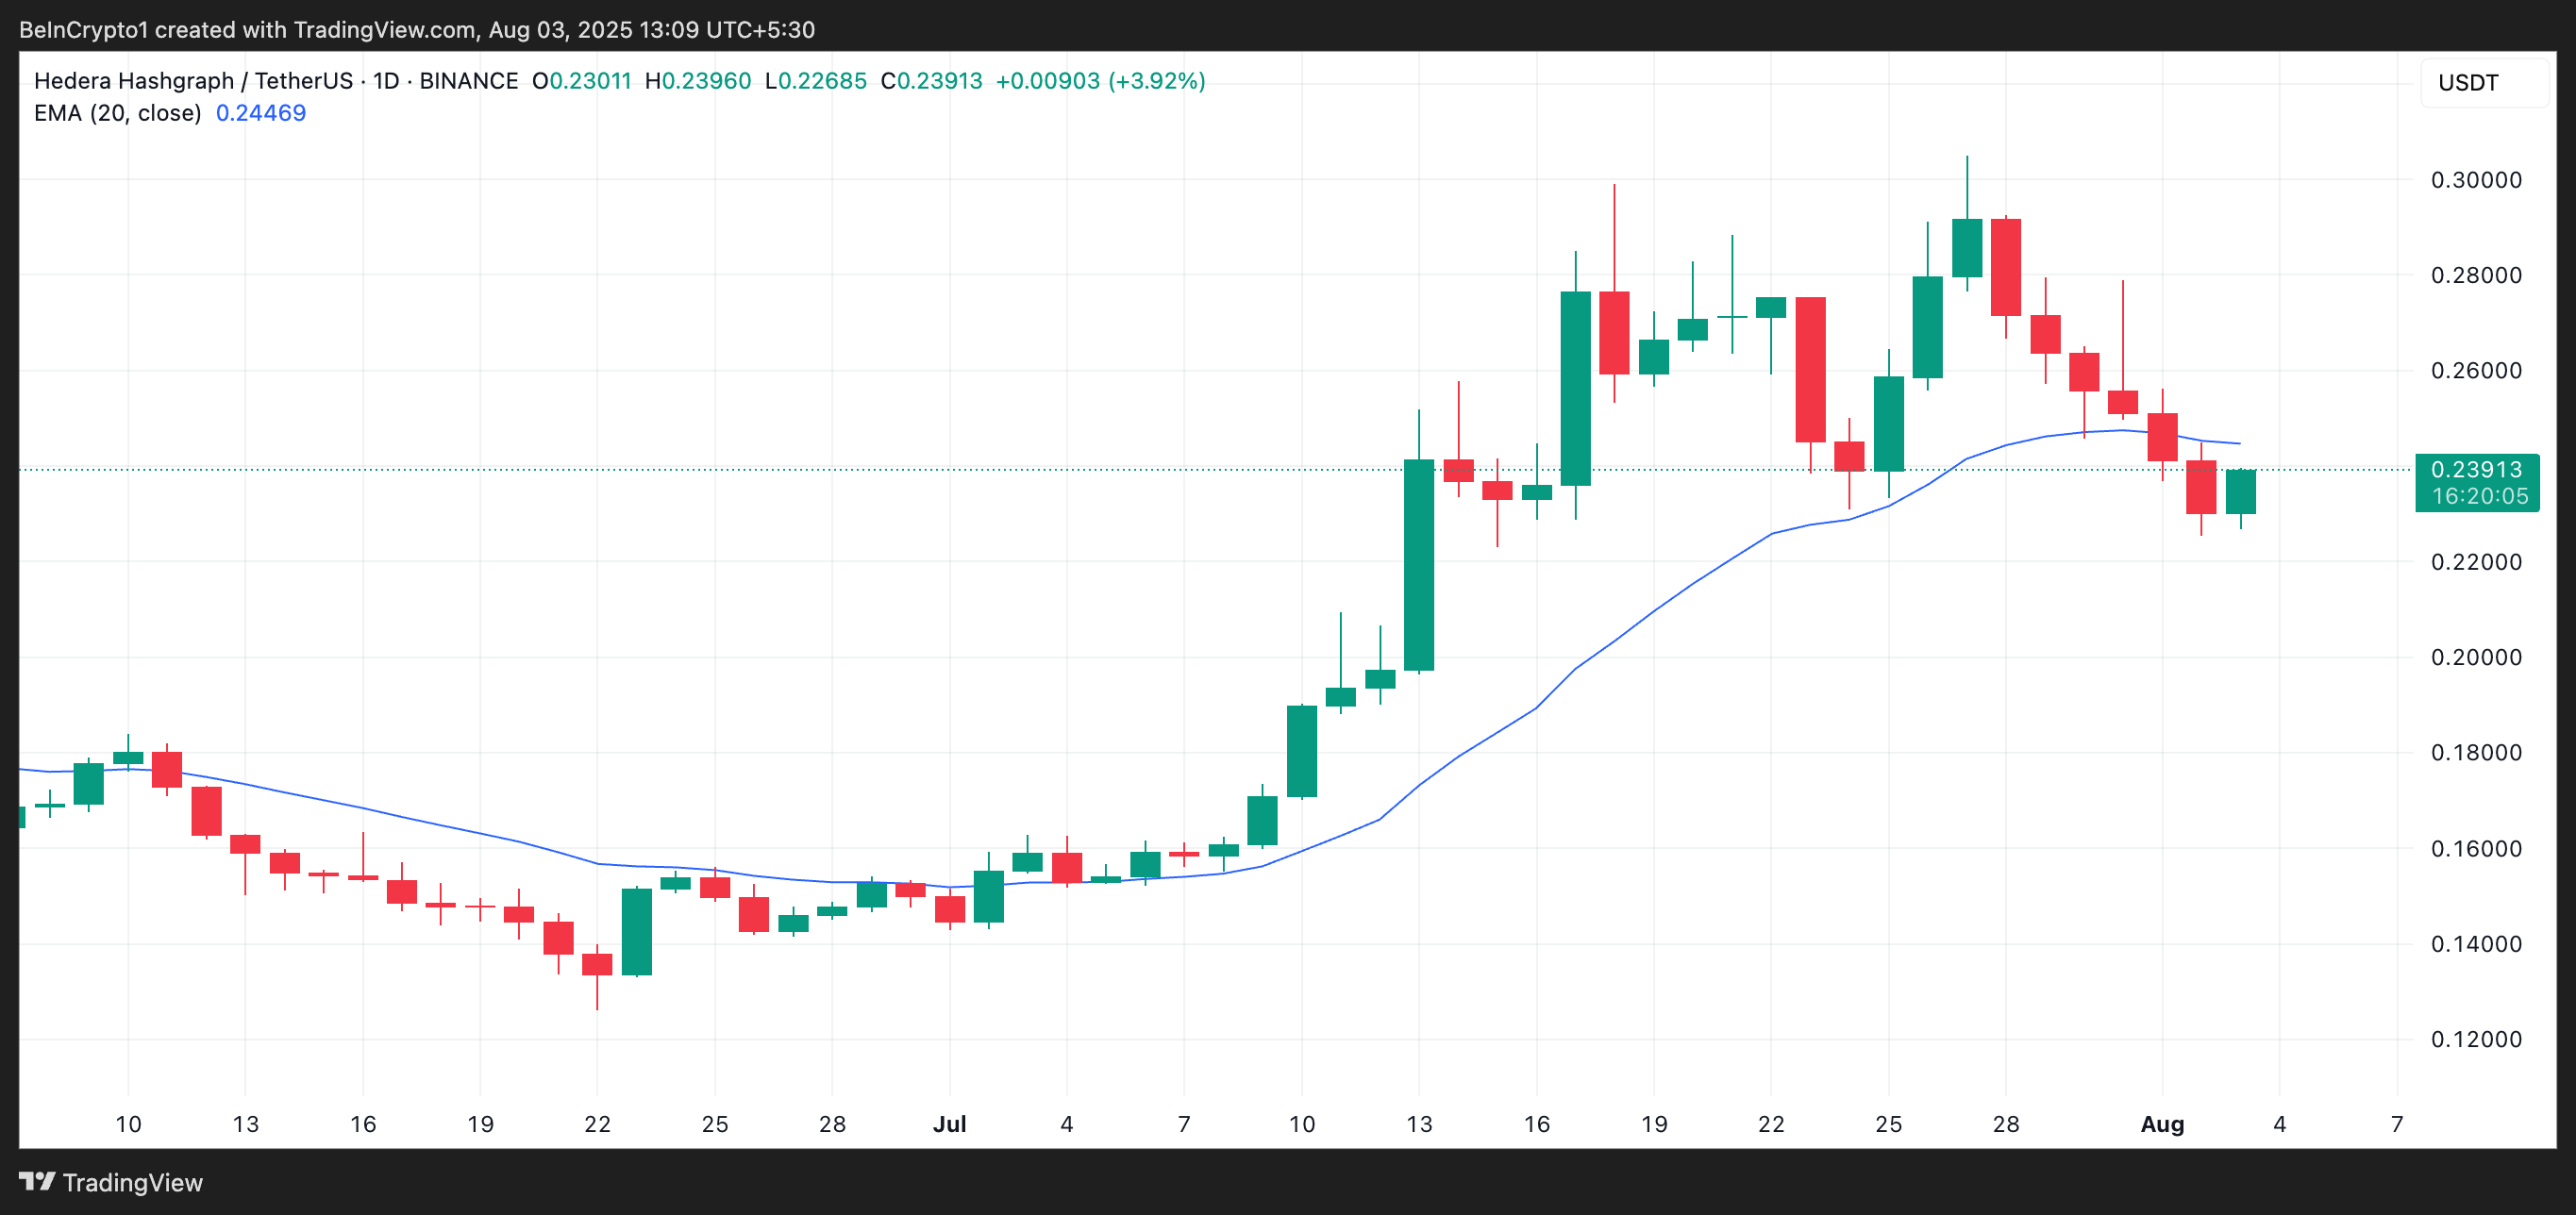
Readings from the one-day chart show that HBAR’s double-digit decline has pushed its price below the 20-day Exponential Moving Average (EMA).
As of this writing, this key moving average forms dynamic resistance above the token’s price at $0.2446. For context, HBAR currently trades at $0.2391.
Want more token insights like this? Sign up for Editor Harsh Notariya’s Daily Crypto Newsletter
 HBAR 20-Day EMA. Source:
TradingView
HBAR 20-Day EMA. Source:
TradingView
The 20-day EMA measures an asset’s average price over the past 20 trading days, giving weight to recent prices. When price trades above the 20-day EMA, it signals short-term bullish momentum and suggests buyers are in control.
On the other hand, when an asset’s price breaks below this level, it signals increased sell-side pressure and weakening short-term support. This puts HBAR at risk of logging more losses over the next few trading sessions.
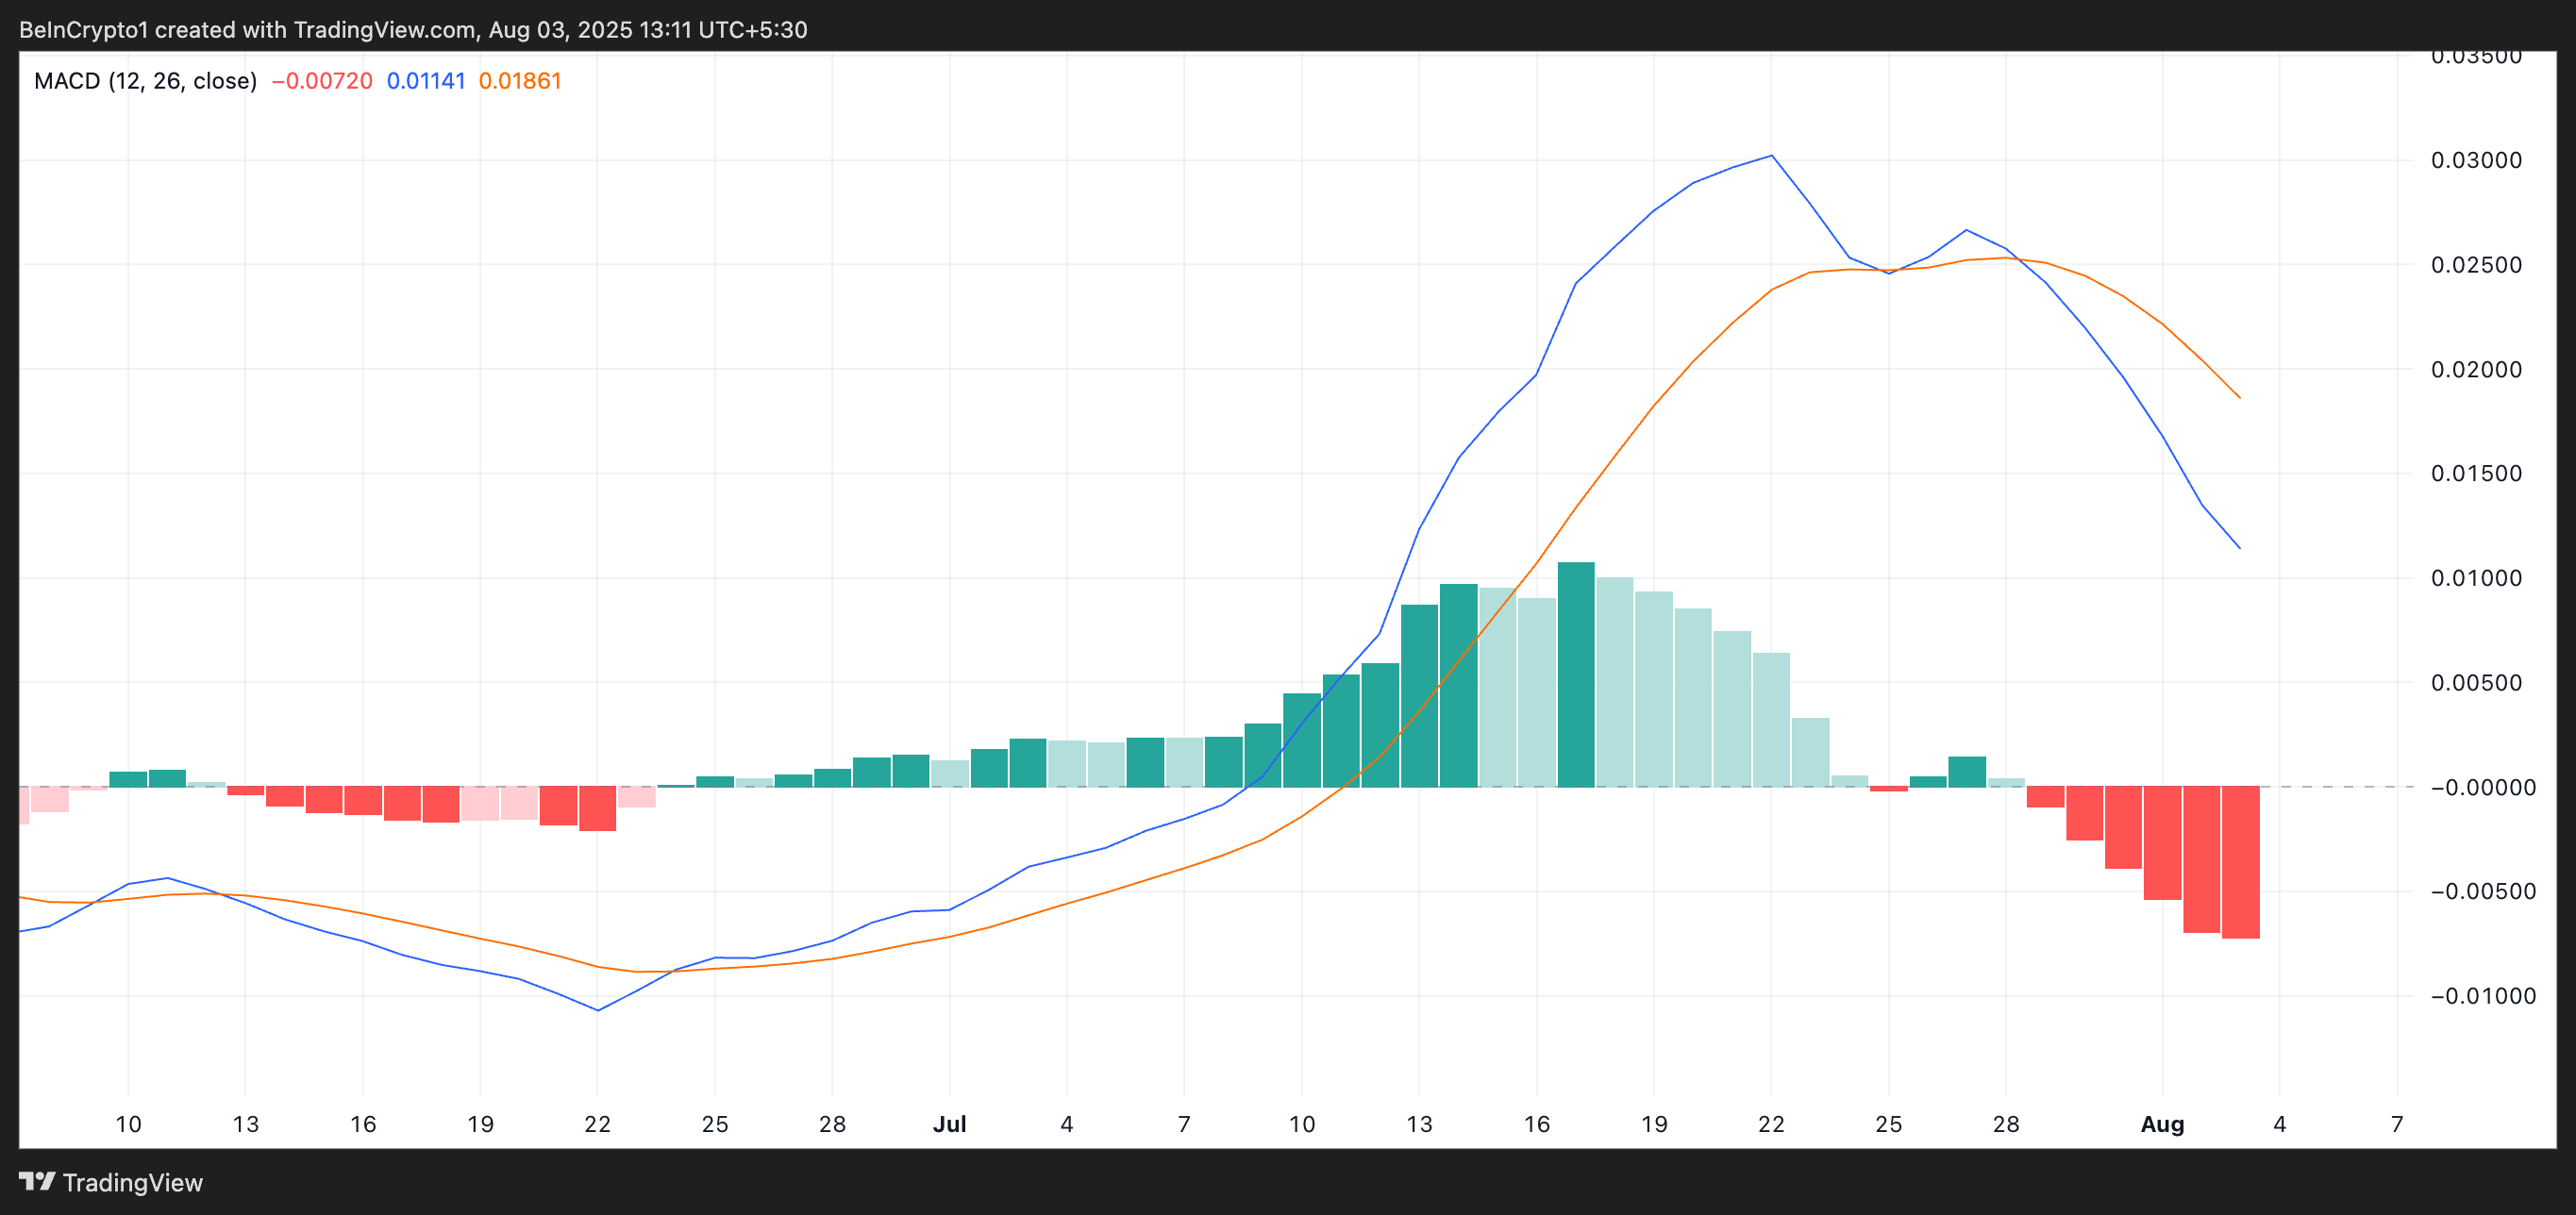
Furthermore, the setup of the altcoin’s Moving Average Convergence Divergence (MACD) indicator supports this bearish outlook.
As of this writing, HBAR’s MACD line (blue) rests below the signal line (orange), while the red histogram bars have grown in size — a sign that bearish momentum is accelerating.
 HBAR MACD. Source:
TradingView
HBAR MACD. Source:
TradingView
The MACD indicator identifies trends and momentum in its price movement. It helps traders spot potential buy or sell signals through crossovers between the MACD and signal lines.
As with HBAR, when the MACD line rests below the signal line, it signals declining buying pressure and growing sell-side strength. This further supports the case for continued downside in the short term.
Can a Sentiment Shift Save the Token?
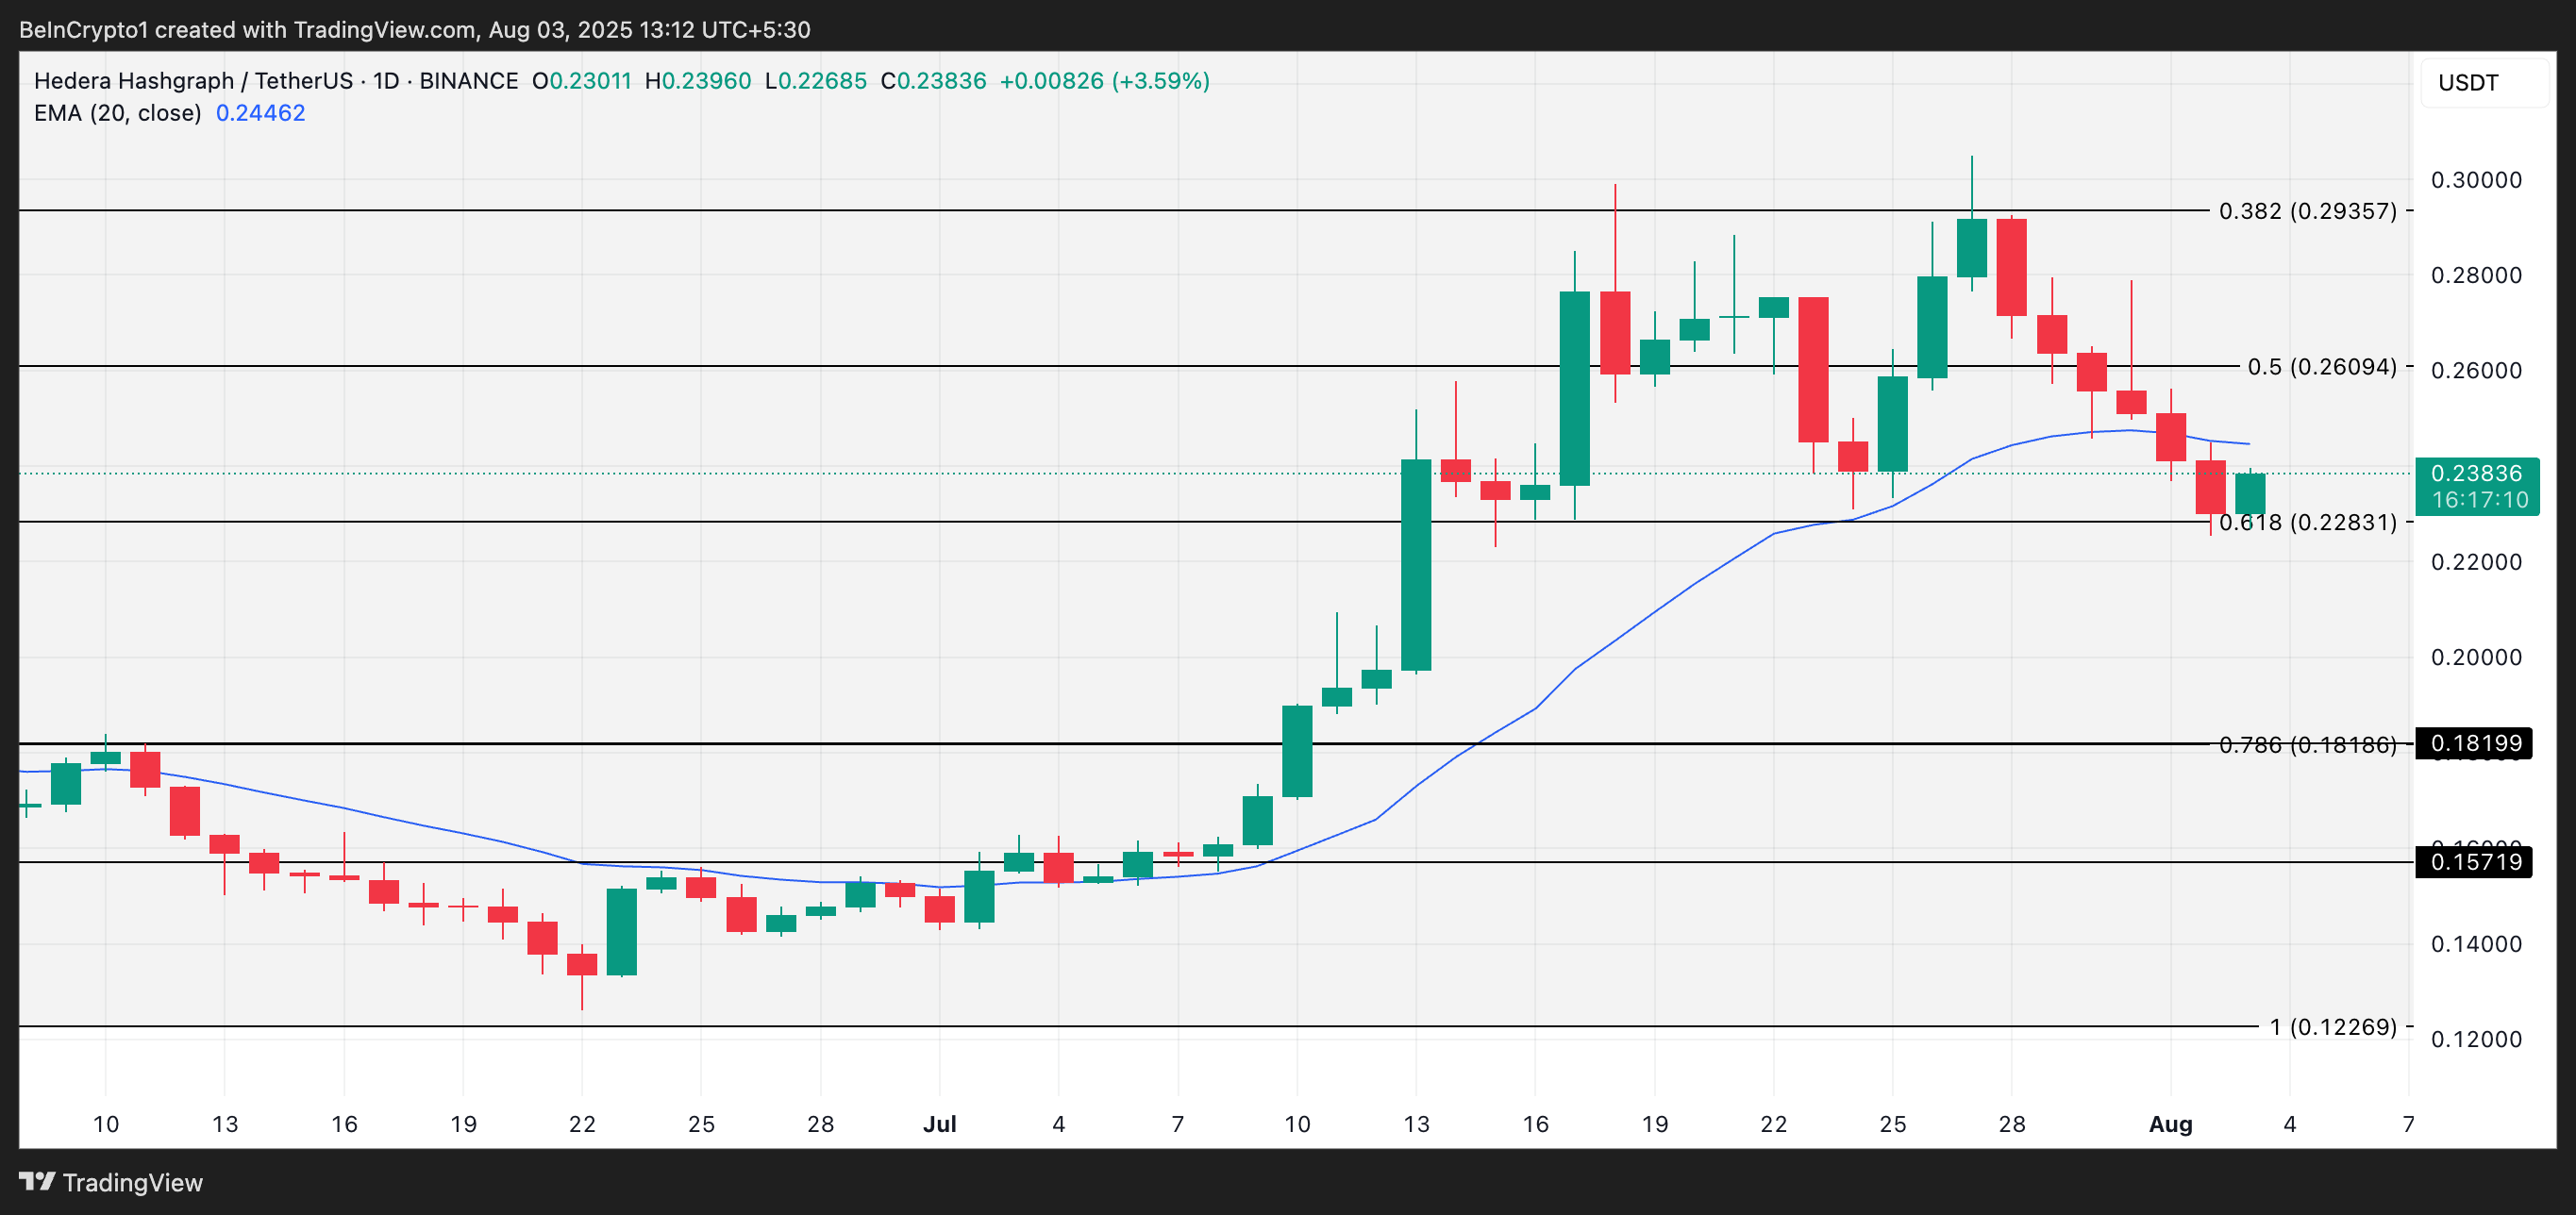
HBAR may be on course for deeper losses in the coming days as selloffs strengthen. In this scenario, its price could fall below $0.2283.
 HBAR Price Analysis. Source:
TradingView
HBAR Price Analysis. Source:
TradingView
However, if sentiment shifts and a strong support base forms, it could drive the token’s price past the 20-day EMA and toward $0.2609.
Disclaimer: The content of this article solely reflects the author's opinion and does not represent the platform in any capacity. This article is not intended to serve as a reference for making investment decisions.
You may also like
US and European interest rate trends may diverge! Citadel Securities: Energy shocks and high interest rates may increase downward pressure on the European economy
Castle Securities believes that although energy price shocks and the tightening of monetary policy by the European Central Bank have driven European bond yields to continue rising, these two forces may ultimately also act as factors limiting further increases in yields.

Bank of America (BAC.US) once plunged 6% as CEO sends cautious signal: Q3 trading revenue expected to be flat year-over-year, investment banking fee income may fall short of expectations
Bank of America CEO Brian Moynihan stated that the bank's trading revenue for the third quarter is expected to be "roughly flat" compared to the same period last year, indicating that after strong growth in the first half of the year, the growth momentum of Wall Street trading businesses is slowing down.

Overnight US Stocks | Three Major Indices Closed Lower, AI Giants Jointly Call for Slowing Development, Concept Stocks Plunge Across the Board
At the close, the Dow Jones Industrial Average fell by 152.01 points, or 0.29%, to 52,421.28 points; the S&P 500 Index dropped by 37.03 points, or 0.48%, to 7,619.95 points; and the Nasdaq Composite Index declined by 146.62 points, or 0.56%, to 26,186.41 points.

Bitcoin ETF See $463 Million Exit In Just Four Sessions

Crypto prices
More


