Tron (TRX) is one of a very small band of altcoins that is currently close to its all-time high. Is this surge set to continue, or is a reckoning about to take place?
Impressive upward trend for $TRX
Source: TradingView
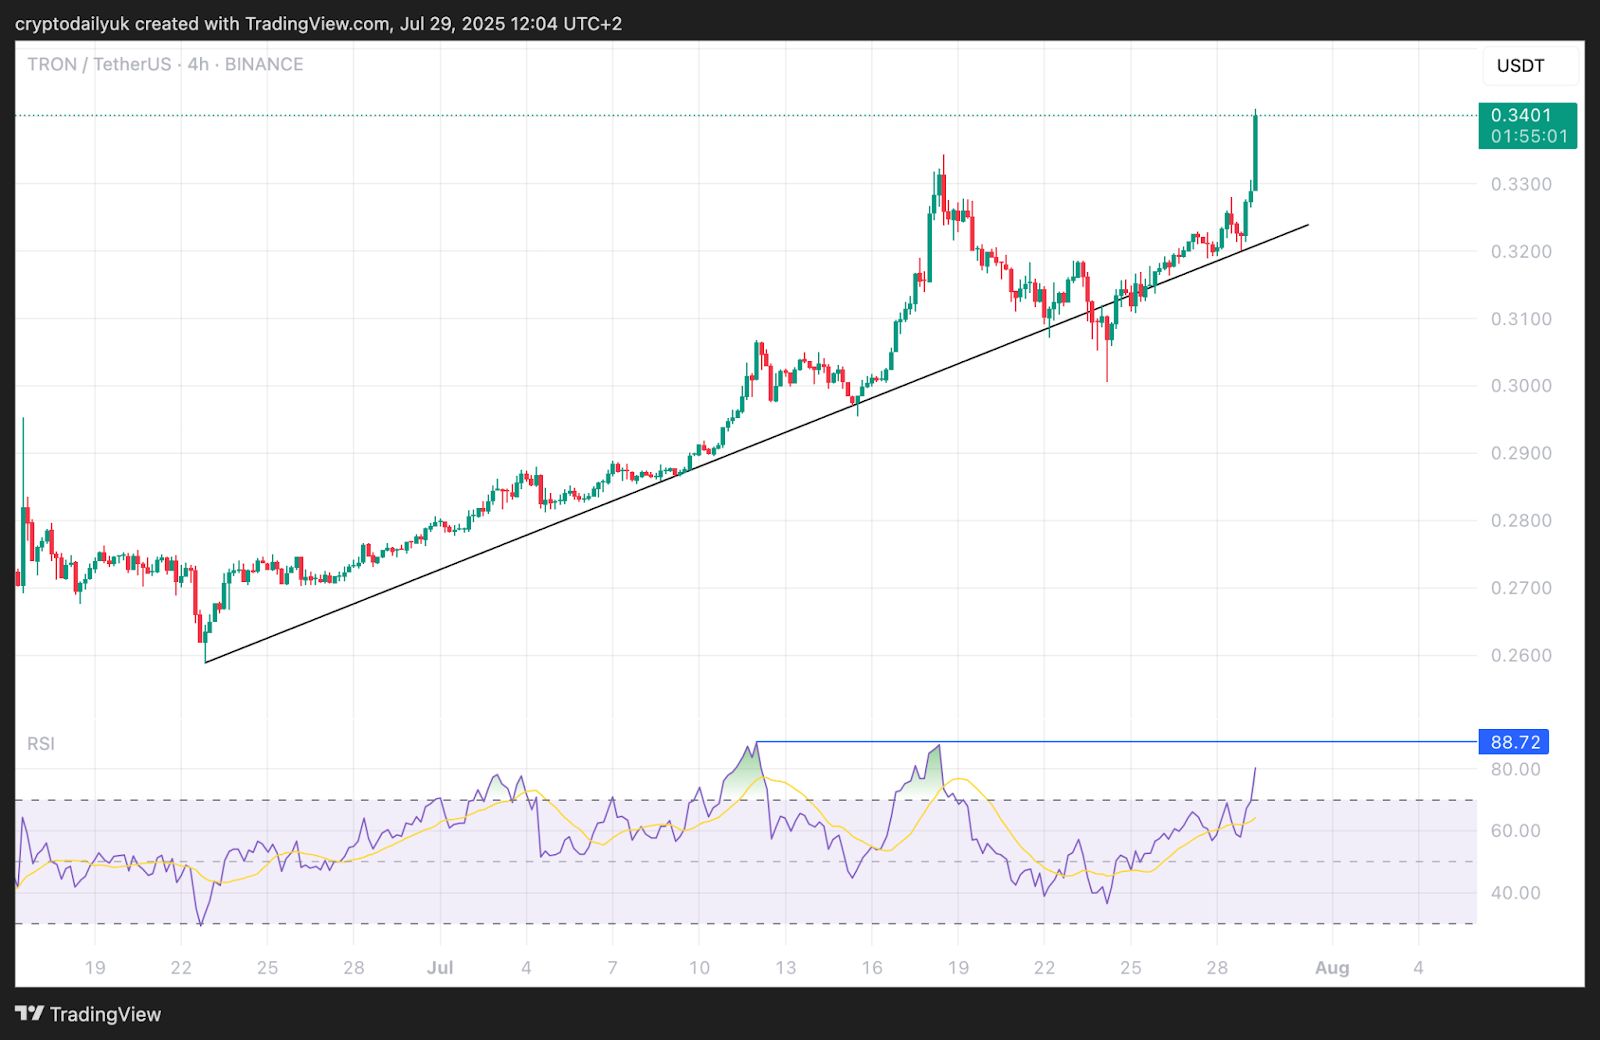
The upward trend for $TRX is certainly impressive. After a huge surge to $0.45 last December, the $TRX price fell precipitously and crashed to $0.20. However, after an extended period of sideways consolidation, the price has begun its ascent back to that all-time high.
Currently, the price is at $0.34, with the bulls having easily taken out the previous local high at just above $0.33. In fact, a series of higher highs and higher lows have followed ever since the $0.20 local bottom.
At the bottom of the 4-hour chart it can be seen that the RSI indicator line has moved out into overbought territory, but that it still needs to climb above the previous high at just under 89.00 in order to avoid bearish divergence.
$TRX price becoming parabolic
Source: TradingView
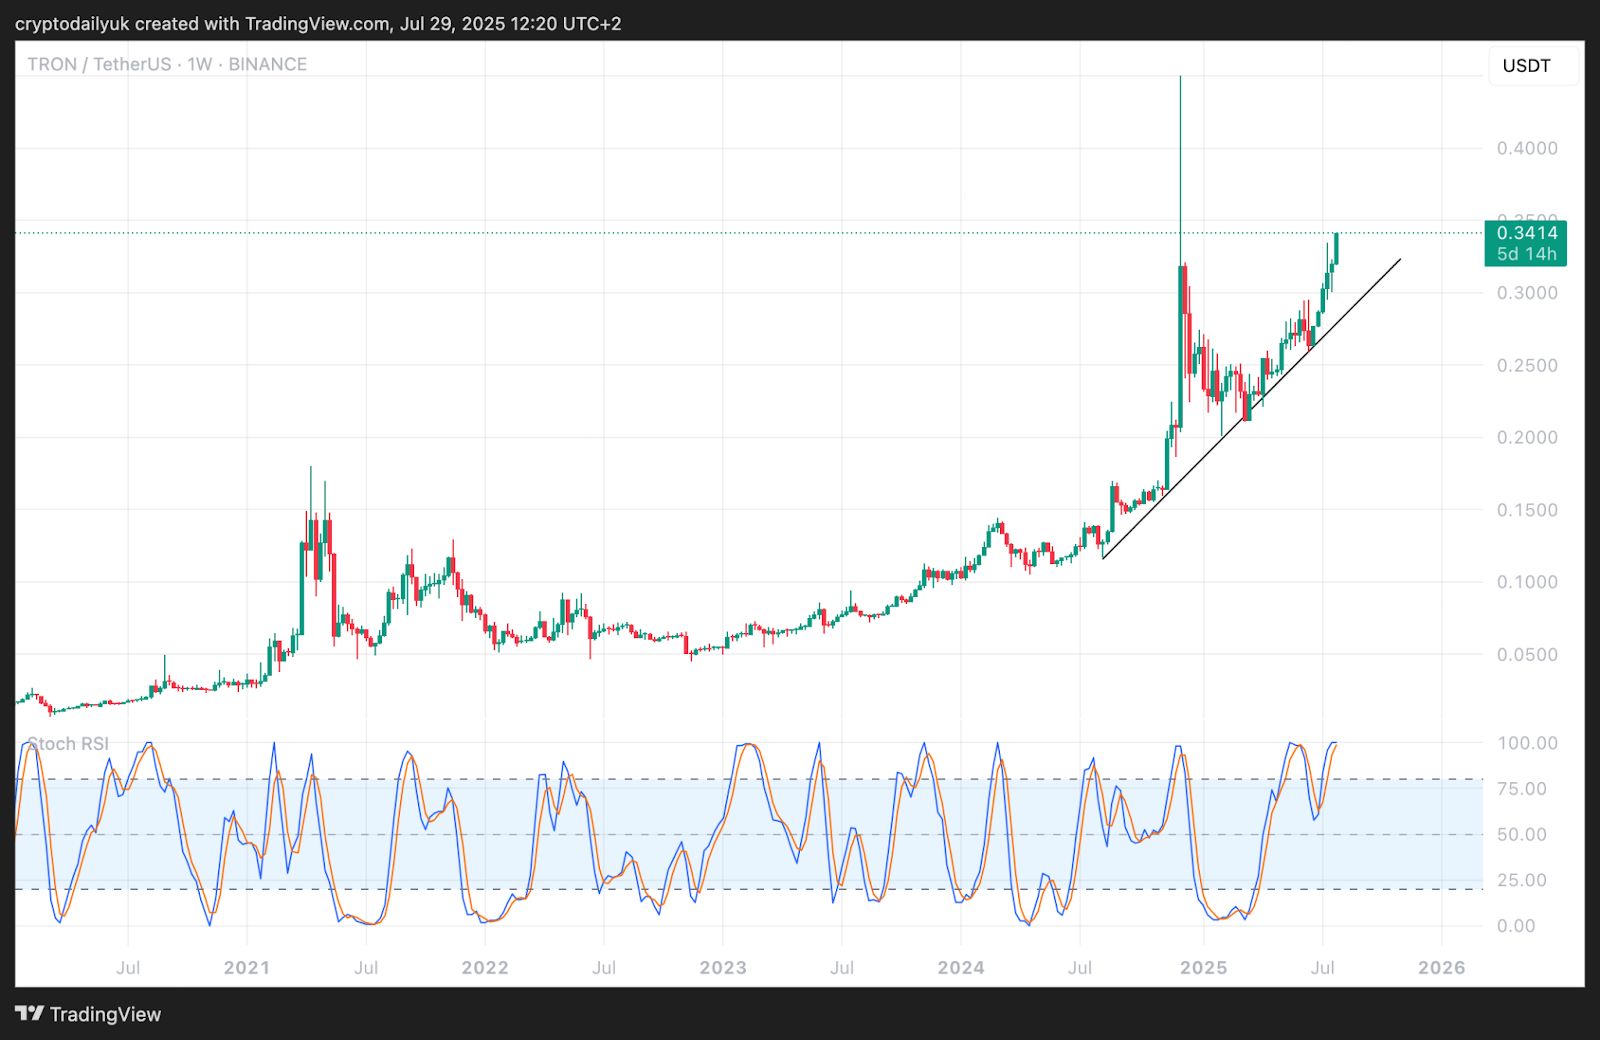
The weekly view puts the current parabolic nature of the $TRX climb into perspective. If Bitcoin does eventually break out, it might be expected that $TRX will carry on outperforming. That said, the indicator lines on the Stochastic RSI are at the top, perhaps signalling that some kind of a pullback is incoming.
TRX/BTC pair suggests much work still to be done
Source: TradingView
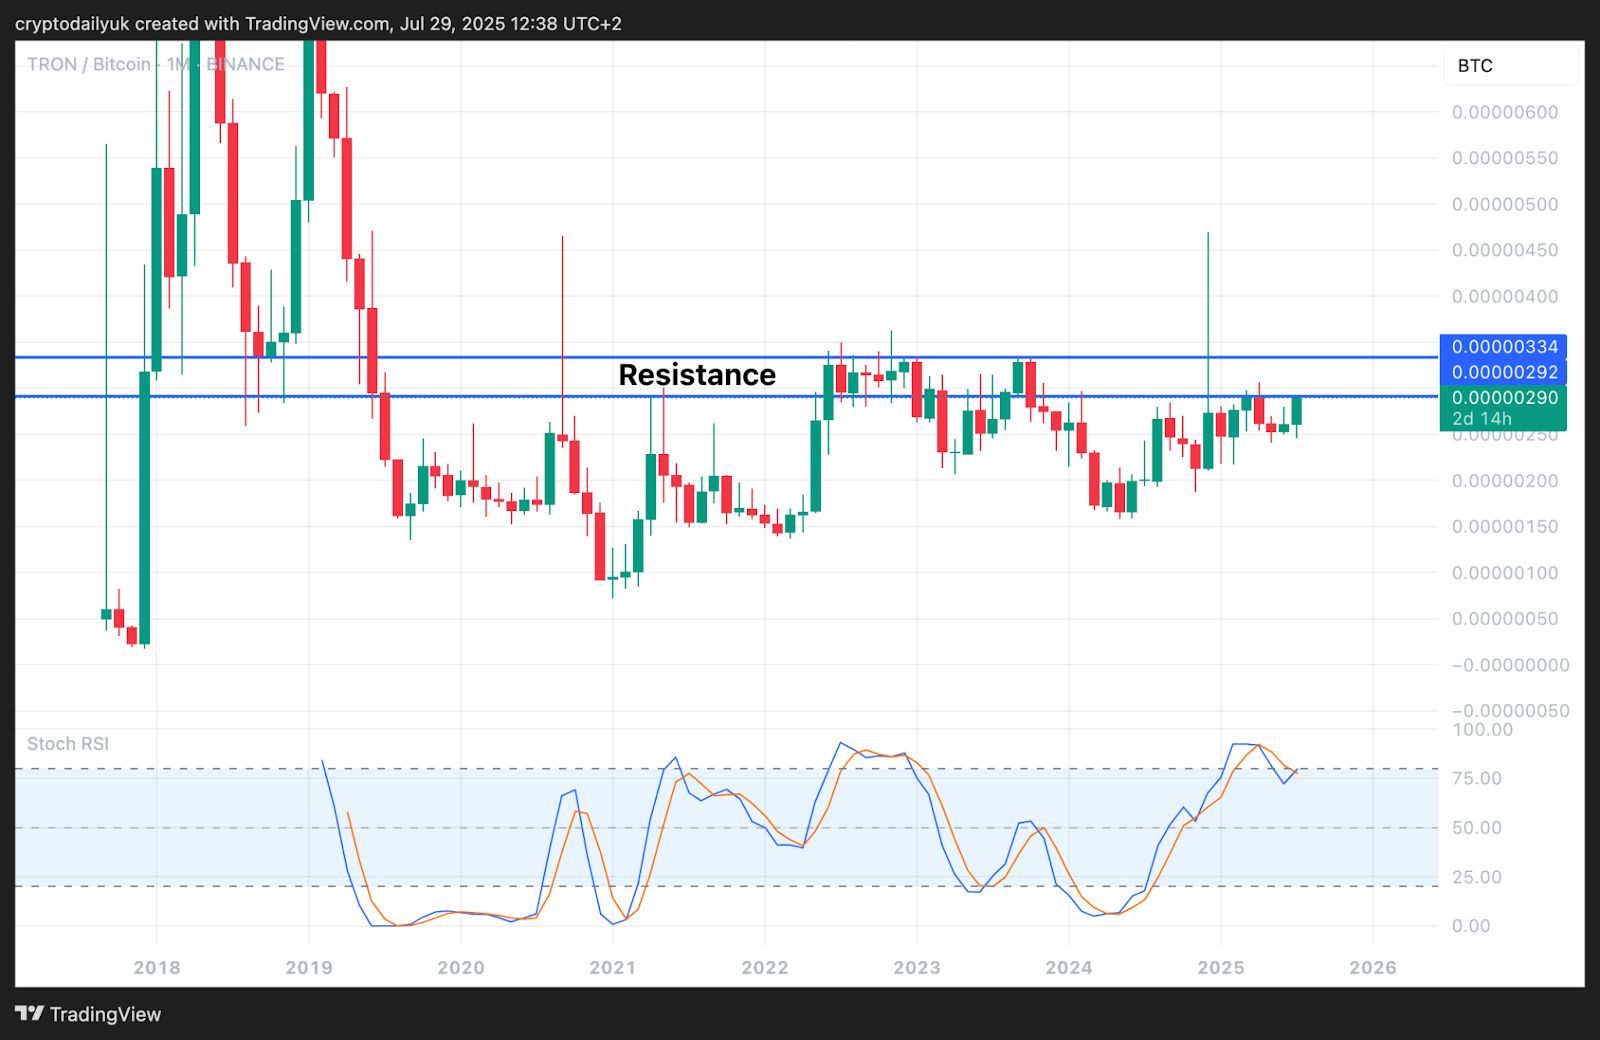
Looking at $TRX against its $BTC pairing on the weekly time frame it can be seen that there is much work still to be done by the $TRX bulls. A strong band of resistance is overhead, and it remains to be seen whether the bulls can overcome this.
At the bottom of the chart, the Stochastic RSI indicators are shaping to cross back up. If this is still the situation at the end of this week, this could provide the upside price momentum for the bulls to push $TRX through the resistance.