
Ethereum Price Skyrockets: What’s Coming Next?

Ethereum price is making headlines again, climbing aggressively as it approaches the key psychological barrier of $4,000. After weeks of consolidation, ETH has erupted with a powerful breakout, leaving behind major resistance zones and signaling renewed bullish momentum. On the daily chart, ETH price has been printing strong Heikin Ashi candles backed by rising volume and an overheated RSI—indicating that the bulls are in full control, at least for now.
But is this breakout sustainable, or are we witnessing the final leg of an overextended rally? In this article, we’ll analyze Ethereum’s price structure, momentum indicators, Fibonacci targets, and likely next moves to determine whether ETH price can truly break the $4K mark —or if a correction is looming.
Ethereum Price Prediction: Why Is Ethereum Price Surging Right Now?
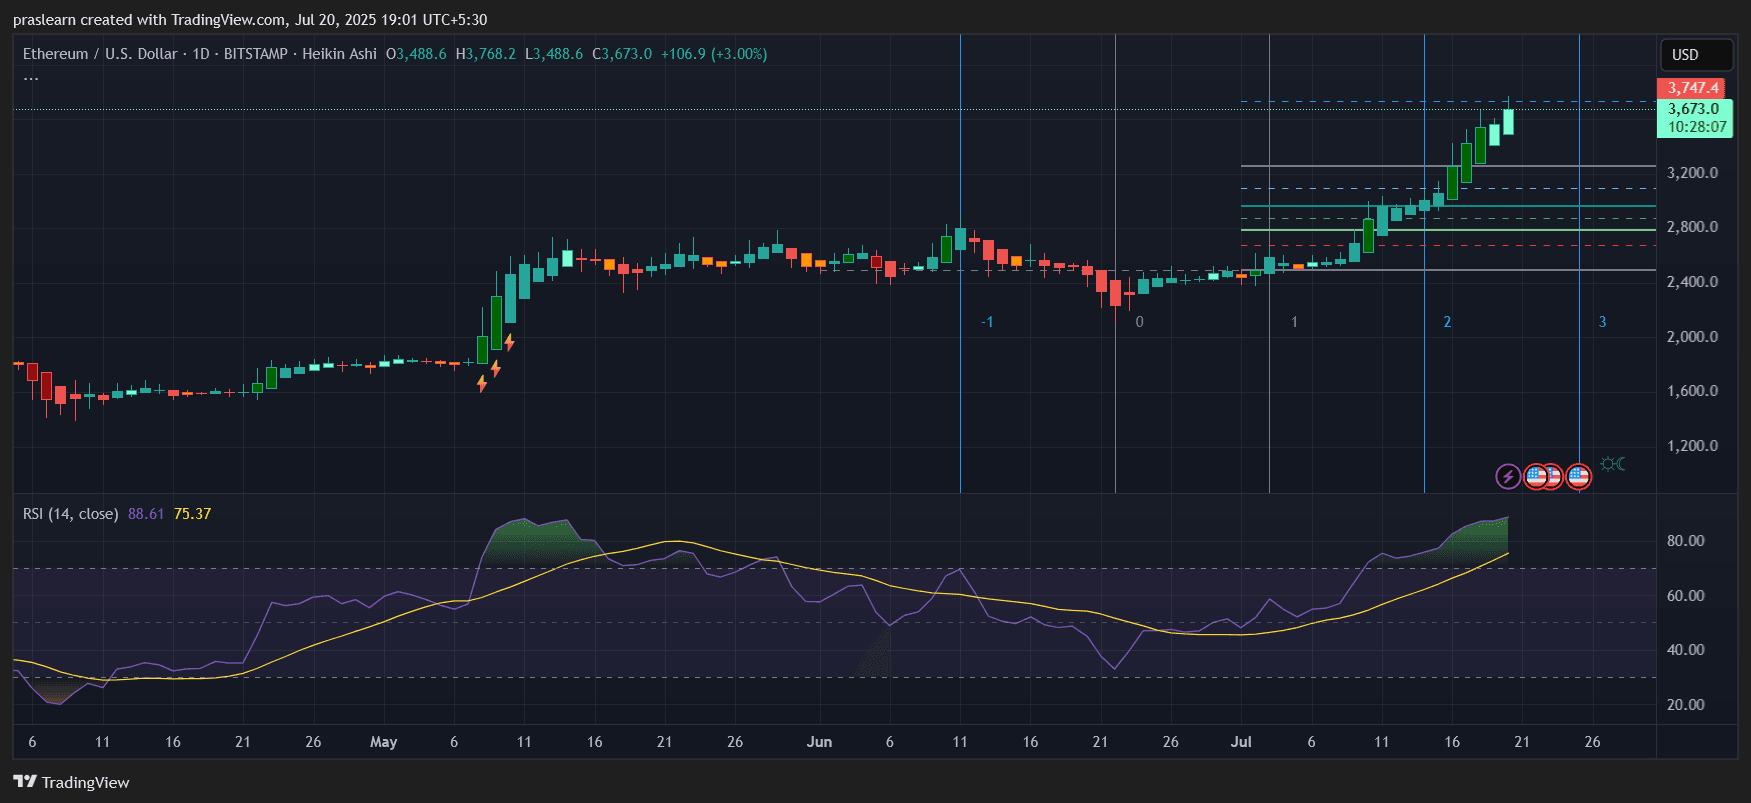 ETH/USD Daily Chart- TradingView
Ethereum (ETH) price is currently on fire , with its price climbing to $3,673—up 3.00% in the last daily candle. The daily chart (Heikin Ashi) shows a strong and consistent bullish trend, with multiple consecutive green candles and minimal wicks to the downside. Momentum has clearly shifted, and Ethereum is challenging key resistance levels near $3,747.4.
The major catalyst seems to be the broader market optimism following renewed ETF speculation and a surge in DeFi activity. However, the chart shows this isn’t just hype—it’s a technically strong move with confirmation from indicators.
What Does the RSI Say About Ethereum’s Strength?
The Relative Strength Index (RSI) is currently at 88.61, well above the traditional overbought threshold of 70. This extreme reading is rare and signals tremendous momentum—but also a potential short-term cooling.
Historically, when Ethereum’s RSI reaches these levels, a pullback or consolidation follows within 5–7 days. However, overbought conditions during strong breakouts often lead to bullish continuations if volume supports the trend.
Here’s a historical context:
In May 2021, ETH's RSI reached 88, followed by a 10% rise before a 15% correction.
A similar setup now suggests Ethereum could hit $3,950–$4,000 before facing resistance.
Fibonacci Levels and Breakout Zones
Looking at the Fibonacci retracement levels drawn from the previous swing high and low, Ethereum has broken past multiple retracement zones:
- $2,800 – Previous 0.618 level broken with high volume
- $3,200 – Passed without resistance
- $3,488 – Local breakout level
- $3,747.4 – Next key target zone
If Ethereum price breaks above $3,750 , the next Fibonacci extension target sits at $4,150, which aligns with the psychological round number of $4,000.
Price Projection Calculation:
Let’s use a simple Fibonacci extension method:
If the swing low was $2,400 and swing high is $3,488, the difference is:
$3,488 - $2,400 = $1,088
Fibonacci 1.618 extension = $2,400 + (1.618 × $1,088) = $4,162
This projection points toward a possible $4,150–$4,200 target in the coming weeks.
Is This a Blow-Off Top or the Start of a New Rally?
Currently, Ethereum price is trading in Wave 3 of an Elliott Wave pattern , which typically represents the strongest bullish leg. The chart shows clear impulsive movement without significant retracement, confirming bullish control.
The lack of bearish divergence on the RSI and the strength of the current candles support the case for a continuation rally, at least until $3,950–$4,150.
However, traders should note:
- ETH is overbought
- Pullbacks to $3,200 or $2,950 are possible
- Strong support lies between $2,850–$3,200
Ethereum Price Prediction for July 2025
Given current momentum, strong Heikin Ashi structure , and RSI-backed breakout, Ethereum price is likely to continue its upward journey.
Short-Term Prediction (Next 7–10 days):
- Bullish scenario: ETH hits $3,950–$4,150
- Consolidation scenario: ETH stabilizes between $3,200–$3,600
- Bearish reversal only if: ETH drops below $2,950
Should You Buy ETH Now?
The technicals support a bullish continuation. However, with RSI so high, short-term pullbacks are natural and even healthy. If you're looking to enter, consider waiting for a dip near the $3,200 zone—or ride the wave with a tight stop loss.
Ethereum price looks strong, and the chart setup could be signaling the start of a major bullish phase. If it breaks $3,750 convincingly, $4,150 may just be the next destination.
Disclaimer: The content of this article solely reflects the author's opinion and does not represent the platform in any capacity. This article is not intended to serve as a reference for making investment decisions.
You may also like
High interest rates are not the "end" of US stocks? Is profitability the real key?
JPMorgan believes that profit growth is the key factor determining the resilience of U.S. stock valuations. Data since 1950 shows an "inverted U-shaped" relationship between the 10-year U.S. Treasury yield and S&P 500 valuations. Based on current profit levels, yields would need to reach about 5%-6% to significantly compress valuations. As long as profit growth remains above 15%, there is still room for valuations to be re-rated. If the yield curve steepens in a bear market, cyclical sectors such as energy and financials will benefit more; if it flattens, technology stocks will have a relative advantage.
The "Outlier" Investment Art in the New Era of Berky

Chevron (CVX.US) explores alternative hedging for Middle East supply disruptions: targets Argentina and the Mediterranean to drive global LNG growth, seeks deal with India
Chevron is focusing on Argentina and the Mediterranean region, seeking global growth in liquefied natural gas, and plans to reach an agreement with India.

Expert Drops a Bullish Yet Scary Prediction for ETH Price in 2027, $10,000 ATH to $800 Black Swan Event?

Crypto prices
More


