- BONK/USDT broke a multi-month downtrend, posting a 10.12% daily price gain to $0.00001827.
- Market cap rose 10.32% to $1.47 billion, while 24h volume dropped 38.14% to $593.21 million.
- Technicals showroom for further upside, with a target of $0.00004218, representing a 133.25% potential increase.
BONK/USDT has shown notable strength after breaking a critical downtrend resistance on the daily chart. The digital asset climbed by 10.12% over the last 24 hours, reaching a current price of $0.00001827. This move follows weeks of sustained buying pressure, with BONK attempting multiple times to reclaim higher ground.
On the 1-day chart, the breakout towards the descending trendline is highly structural and the breakout itself is towards the descending trendline that marked significant structural change. This trendline had been resistance since November 2024, and limited all prior upside movements. Now, BONK is trading above this former barrier, potentially unlocking further upside momentum.
Technical Indicators Reflect Short-Term Strength
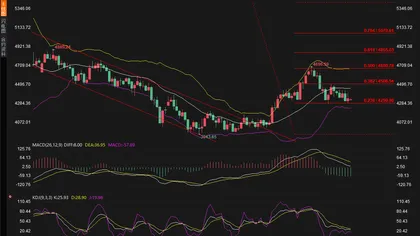
On the 1-hour chart, the momentum indicators continue to affirm strength. The Relative Strength Index (RSI) is at 67.42, which is still higher than the neutral 50 level. But it’s still lower than the 70 overbought level, indicating space for additional price action. Meanwhile, the MACD histogram prints positive values.
 Source: TradingView
The MACD line is 0.00000044 which is slightly higher than the signal line of 0.00000036 indicating a positive trend. These short-term indicators supplement the daily breakout and provide additional information that short-term traders have continued driving price increases.
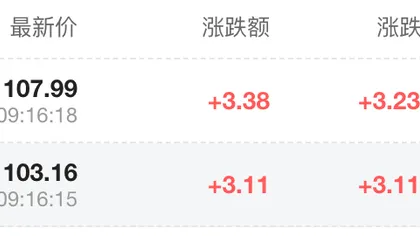
The hourly sell and buy zones remain narrowly defined. BONK’s sell price is posted at $0.00001828, while the buy price sits at $0.00001829. This tight spread reflects an active but cautious market.
Market Activity Sees Fluctuations Despite Breakout
Market capitalization at 24-hour high has increased by 10.32%, up to 1.47 billion dollars. The trading volumes however have decreased by 38.14 percent and are currently at the amount of $593.21 million. This volume decrease, despite a price increase, highlights some hesitation among participants. It also suggests that the breakout has yet to attract a full-scale inflow of new capital.
 Source: CoinMarketCap
Despite these mixed signals, the breakout has cleared the prior trendline resistance, with the next projected price target positioned at $0.00004218. This target level represents a potential gain of 133.25% from current prices.
The daily chart outlines a broad upside zone following the breakout. The measured move highlights the possibility of an extended rally. This range reaches from the breakout point to the $0.00004218 target. In this context, BONK’s recent breakout represents a significant development within its ongoing price structure.